
1. Headline Inflation
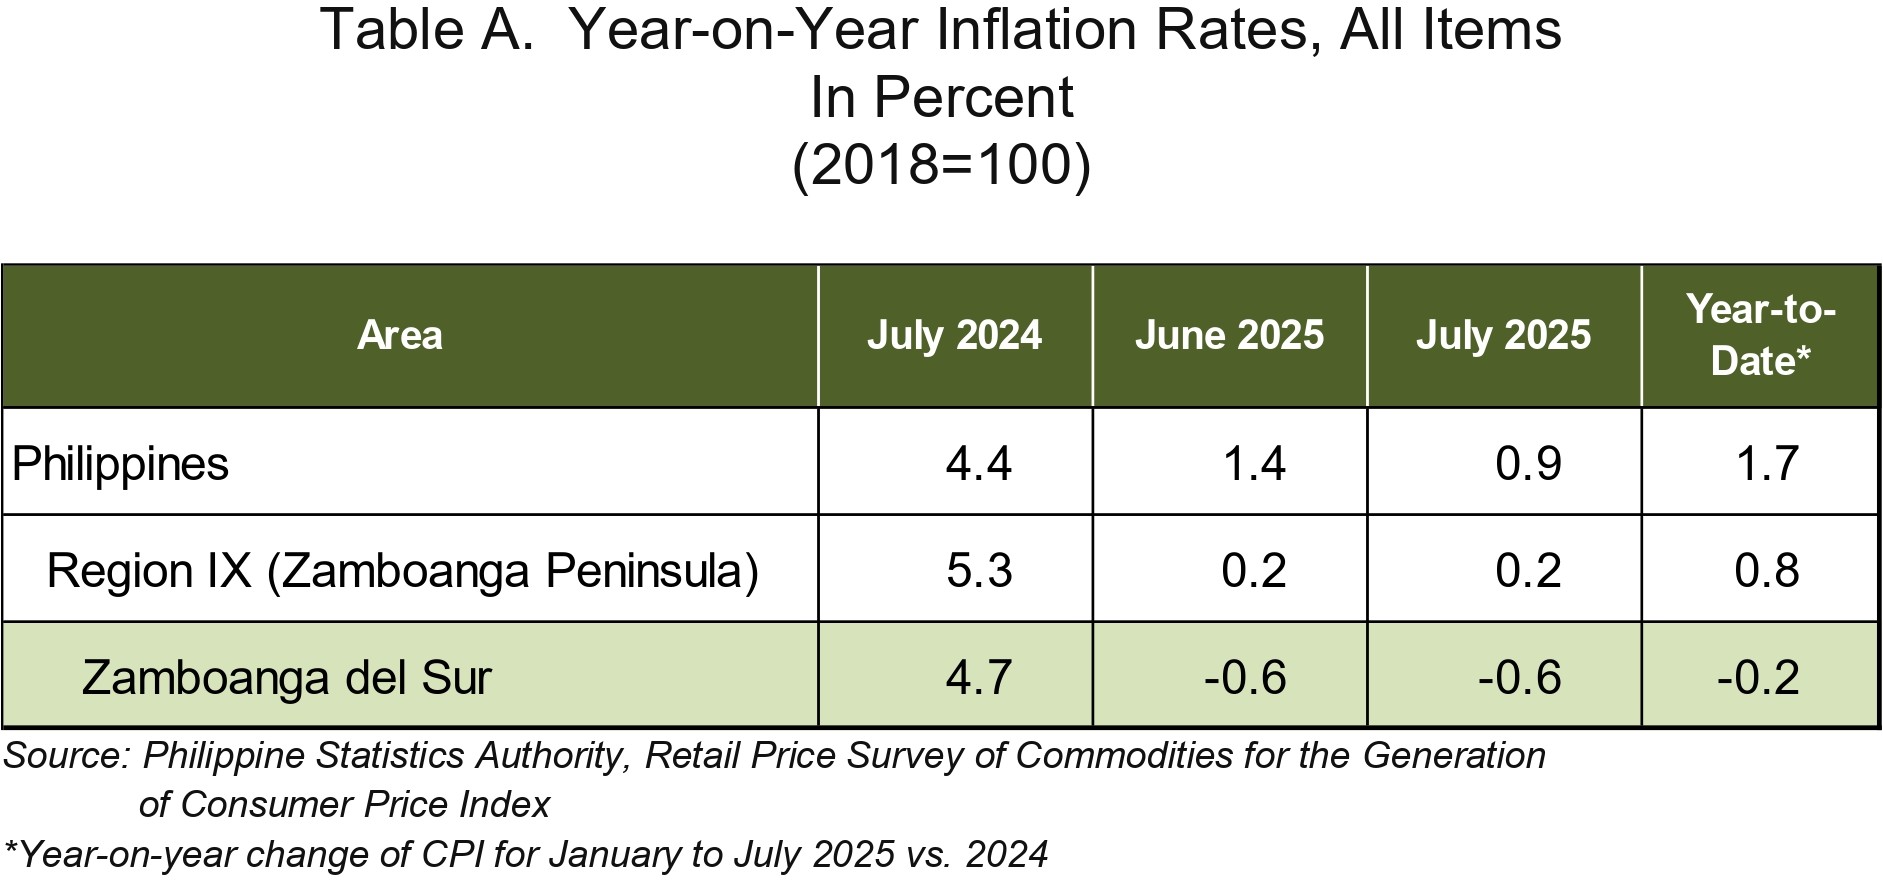
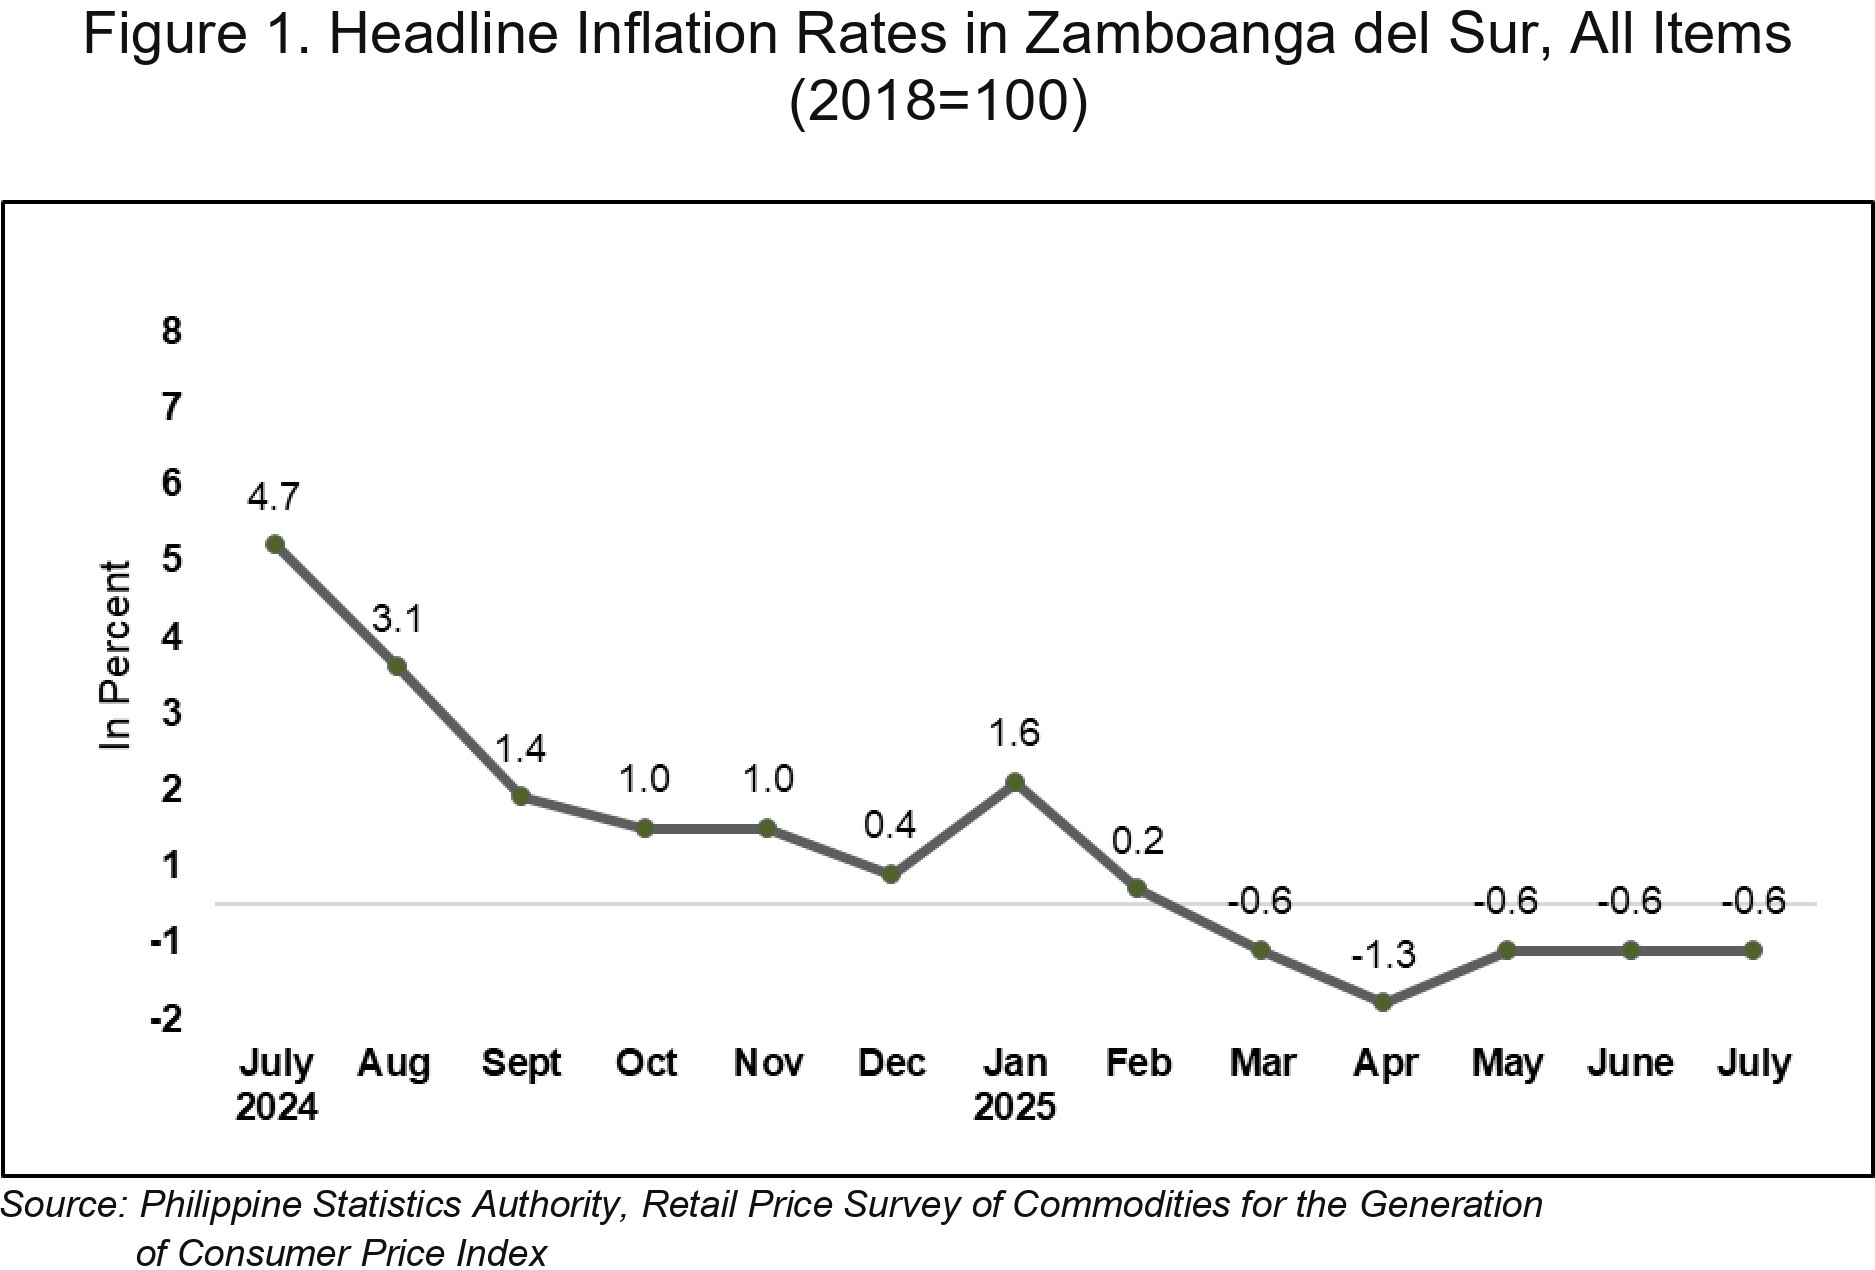
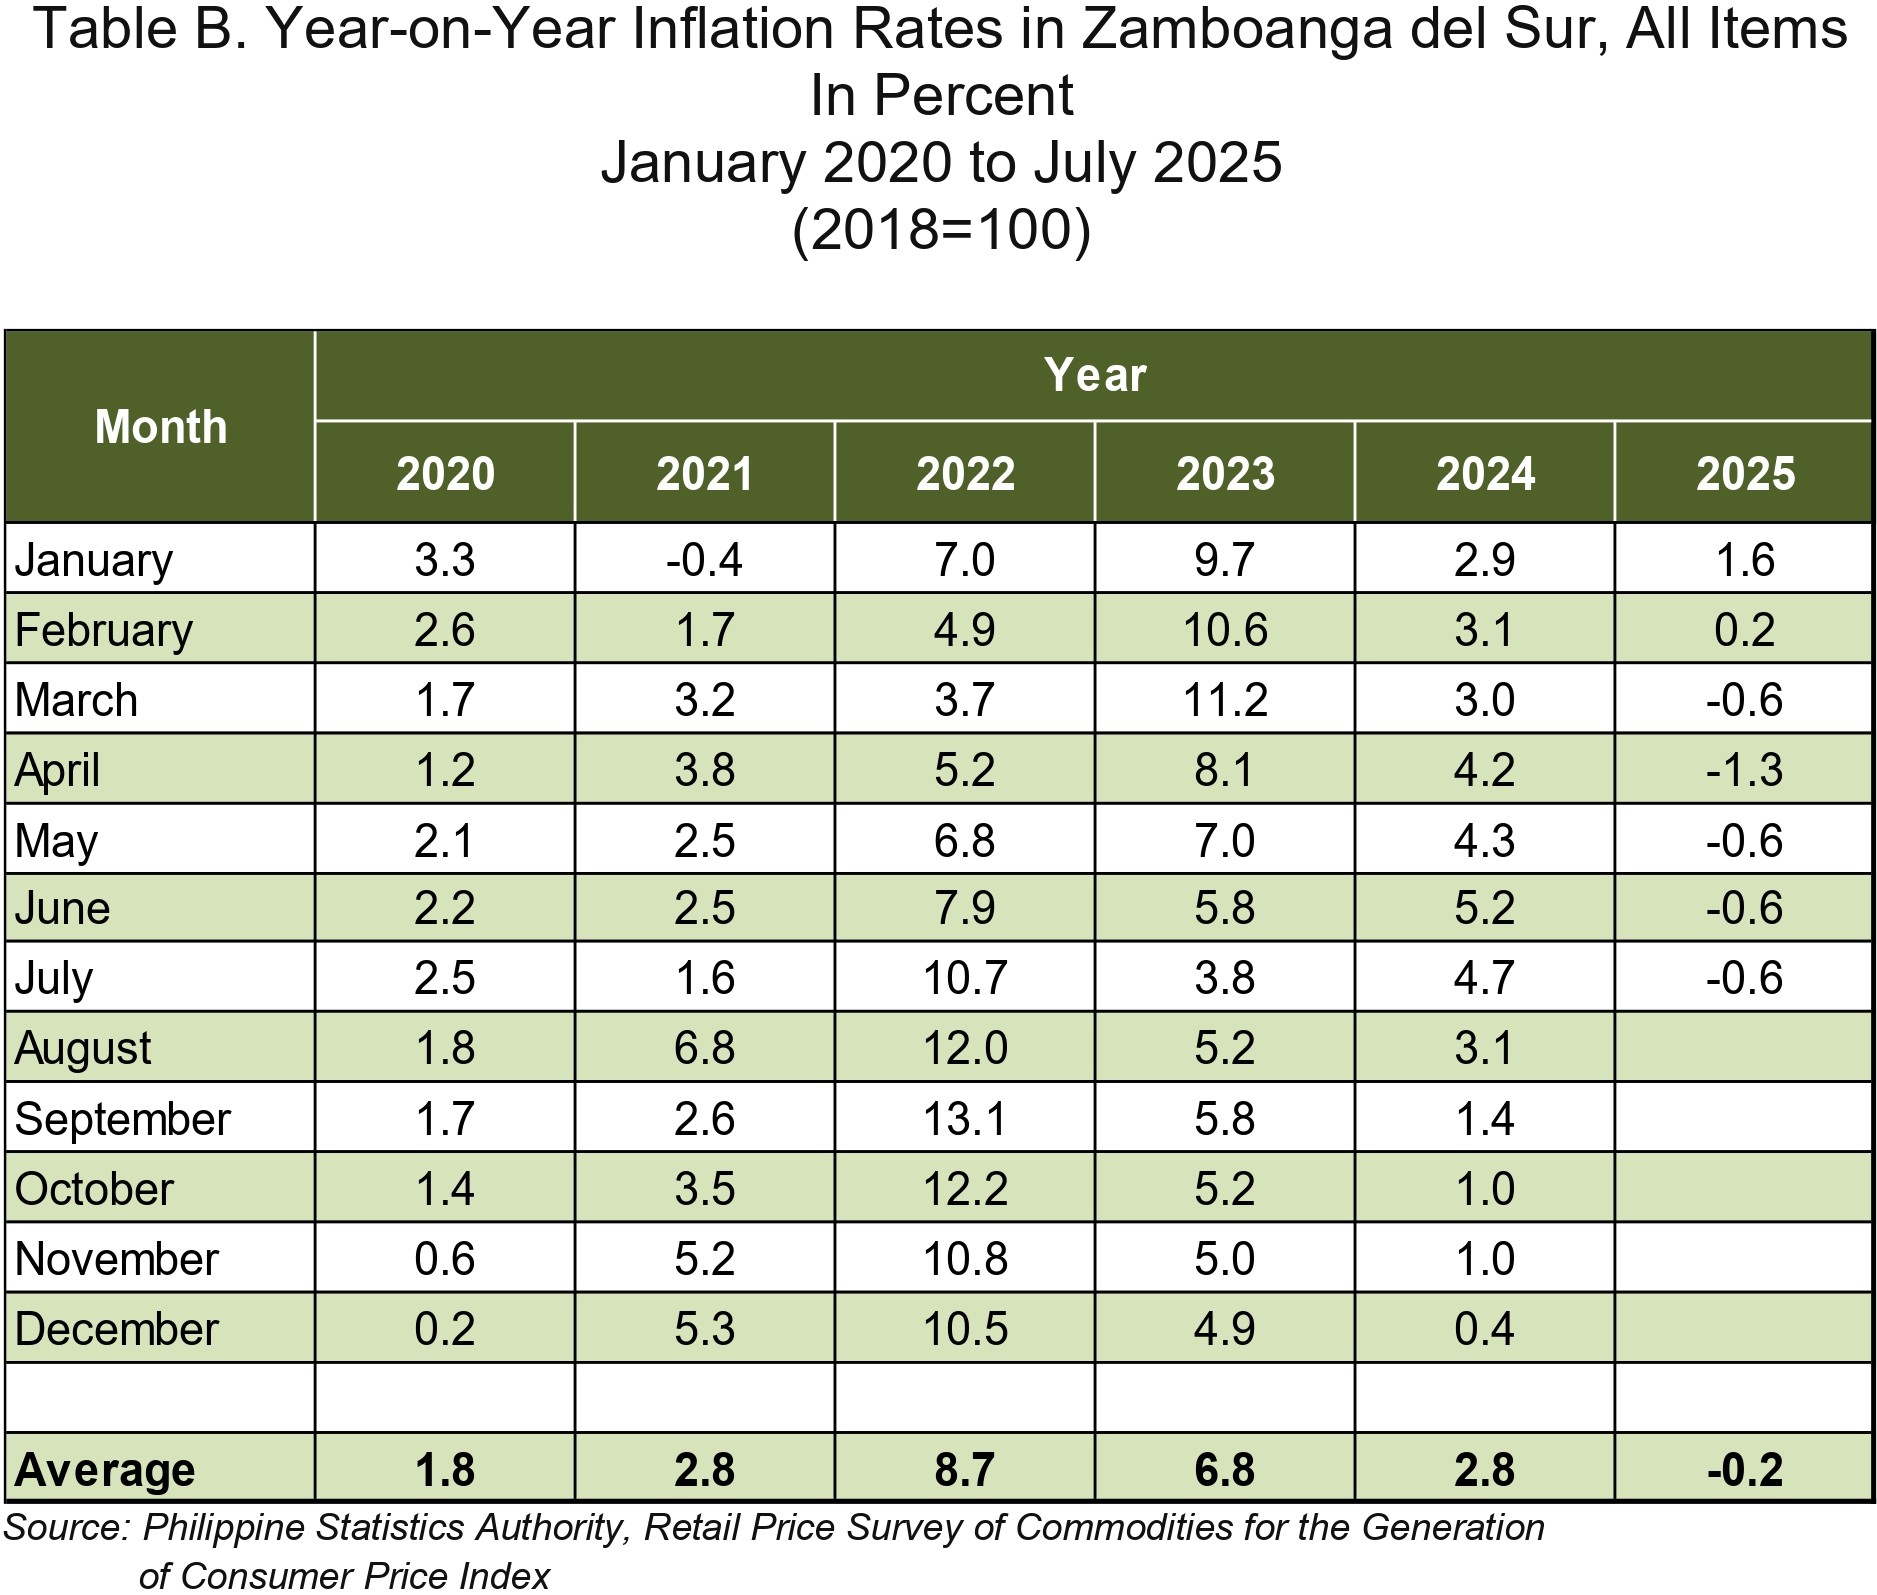
Zamboanga del Sur’s headline inflation or overall inflation remained at -0.6 percent in July 2025 as it recorded the same annual growth rate as in June 2025. This brings the province’s average inflation from January to July 2025 to -0.2 percent. In July 2024, the inflation rate was posted at 4.7 percent.
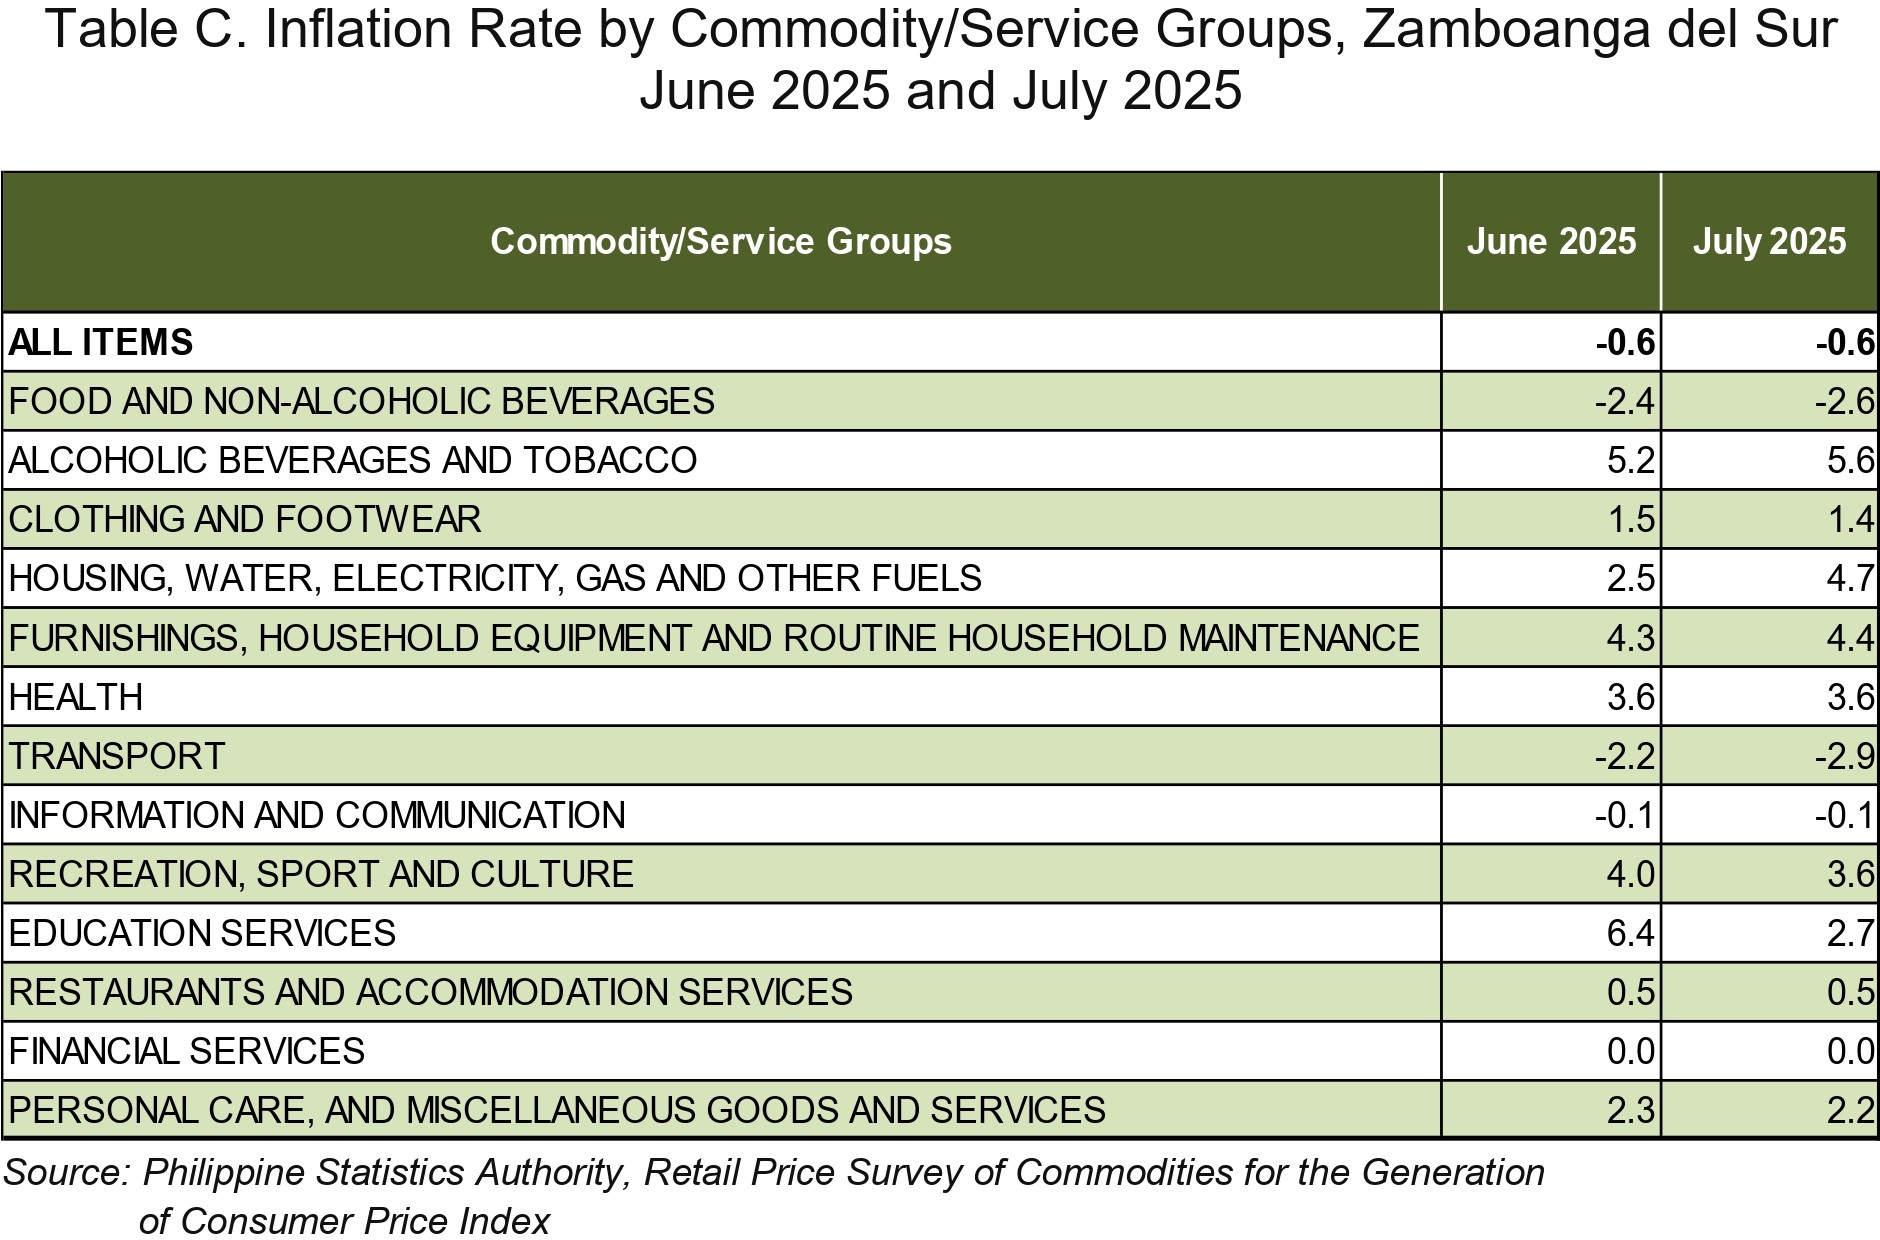
Varied annual growth rates in the indices of the commodity groups were observed in July 2025.
Faster annual increases were observed in the indices of the following commodity groups:
a. Alcoholic beverages and tobacco, 5.6 percent from 5.2 percent;
b. Housing, water, electricity, gas and other fuels, 4.7 percent from 2.5 percent; and
c. Furnishings, household equipment and routine household maintenance, 4.4 percent from 4.3 percent.
On the other hand, the following commodity groups registered lower annual increments during the month:
a. Food and non-alcoholic beverages, -2.6 percent from -2.4 percent;
b. Clothing and footwear, 1.4 percent from 1.5 percent;
c. Transport, -2.9 percent from -2.2 percent;
d. Recreation, sport and culture, 3.6 percent from 4.0 percent;
e. Education services, 2.7 percent from 6.4 percent; and
f. Personal care, and miscellaneous goods and services, 2.2 percent from 2.3 percent.
The indices of health, information and communication, restaurants and accommodation services, and financial services retained their previous month’s annual increment. (Table C)
1.1 Main Contributors to the Headline Inflation
The top three commodity groups contributing to the July 2025 overall inflation were the following:
a. Food and non-alcoholic beverages with 276.4 percent share or -1.66 percentage points;
b. Transport with 32.2 percent share or -0.19 percentage point; and
c. Information and communication with 0.3 percent share or -0.00 percentage point.
2.0 Food Inflation
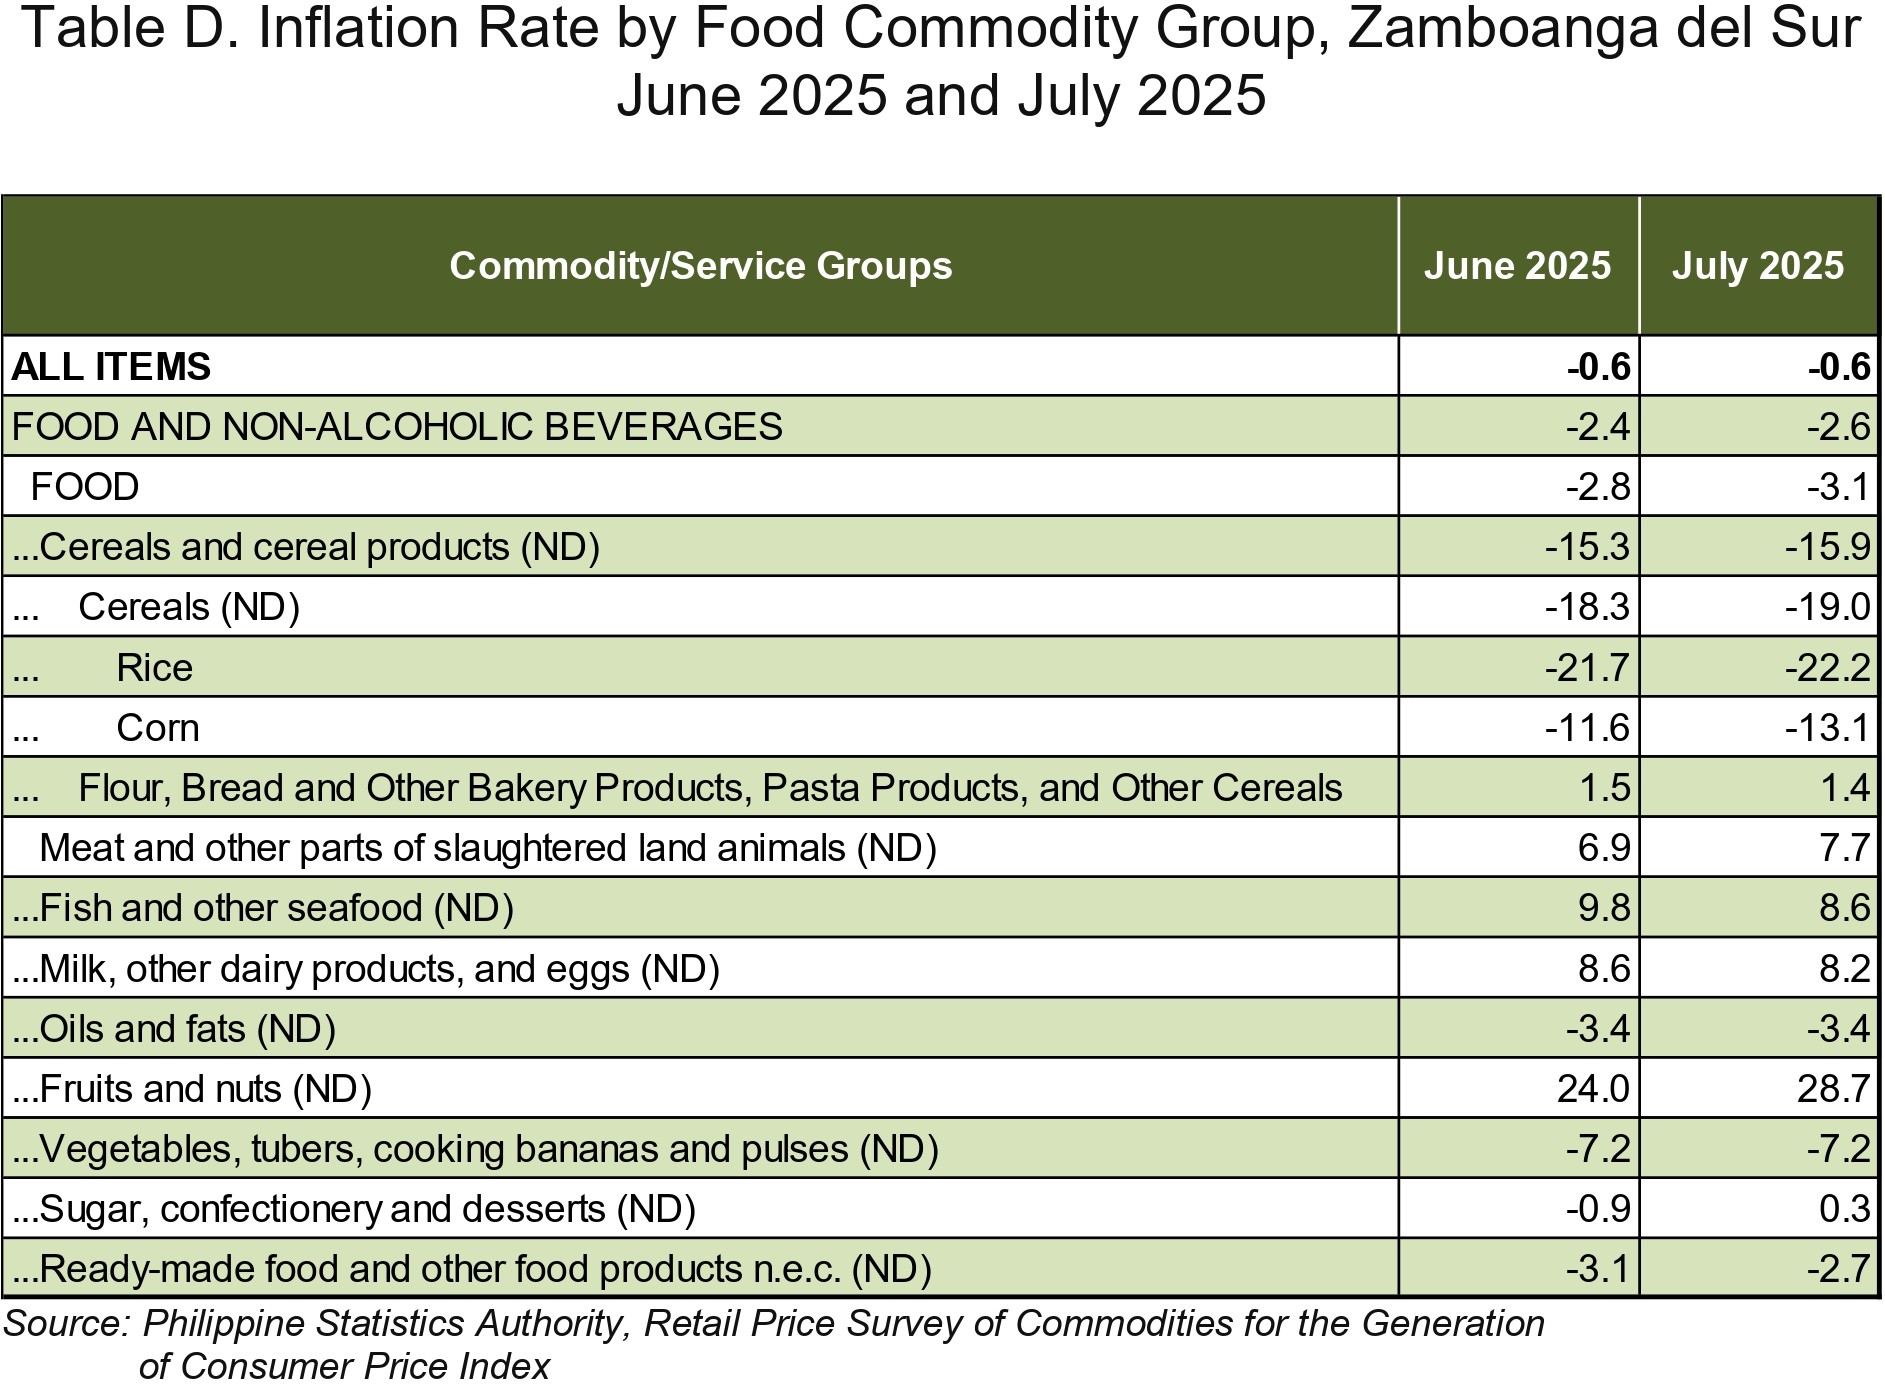
Food inflation in the province further declined to 3.1 percent in July 2025 from an annual drop of 2.8 percent in the previous month.
2.1 Main Drivers to the Downward Trend of Food Inflation
The deceleration of food inflation in July 2025 was primarily brought about by the faster year-on-year decline in the index of cereals and other cereal products at 15.9 percent in July 2025 from an annual drop of 15.3 percent in the previous month. Also contributing to the downtrend was the slower annual increase in the index of fish and other seafood at 8.6 percent during the month from 9.8 percent in June 2025. In addition, the index of milk, other dairy products and eggs recorded a slower annual increase of 8.2 percent in July 2025 from 8.6 percent in the previous month.
In contrast, higher annual rates were noted in the following food groups:
a. Meat and other parts of slaughtered land animals, 7.7 percent from 6.9 percent;
b. Fruits and nuts, 28.7 percent from 24.0 percent;
c. Sugar, confectionery and desserts, 0.3 percent from -0.9 percent; and
d. Ready-made food and other food products, -2.7 percent from -3.1 percent.
2.2 Main Contributors to the Food Inflation
Food inflation shared 301.0 percent or -1.81 percentage points to the overall inflation in July 2025. The top three food groups in terms of contribution to food inflation during the month were the following:
a. Cereals and cereal products with 210.1 percent share or -6.51 percentage points;
b. Vegetables, tubers, plantains, cooking bananas and pulses with 21.3 percent share or -0.66 percentage point; and
c. Ready-made food and other food products with 2.8 percent share or -0.09 percentage point.
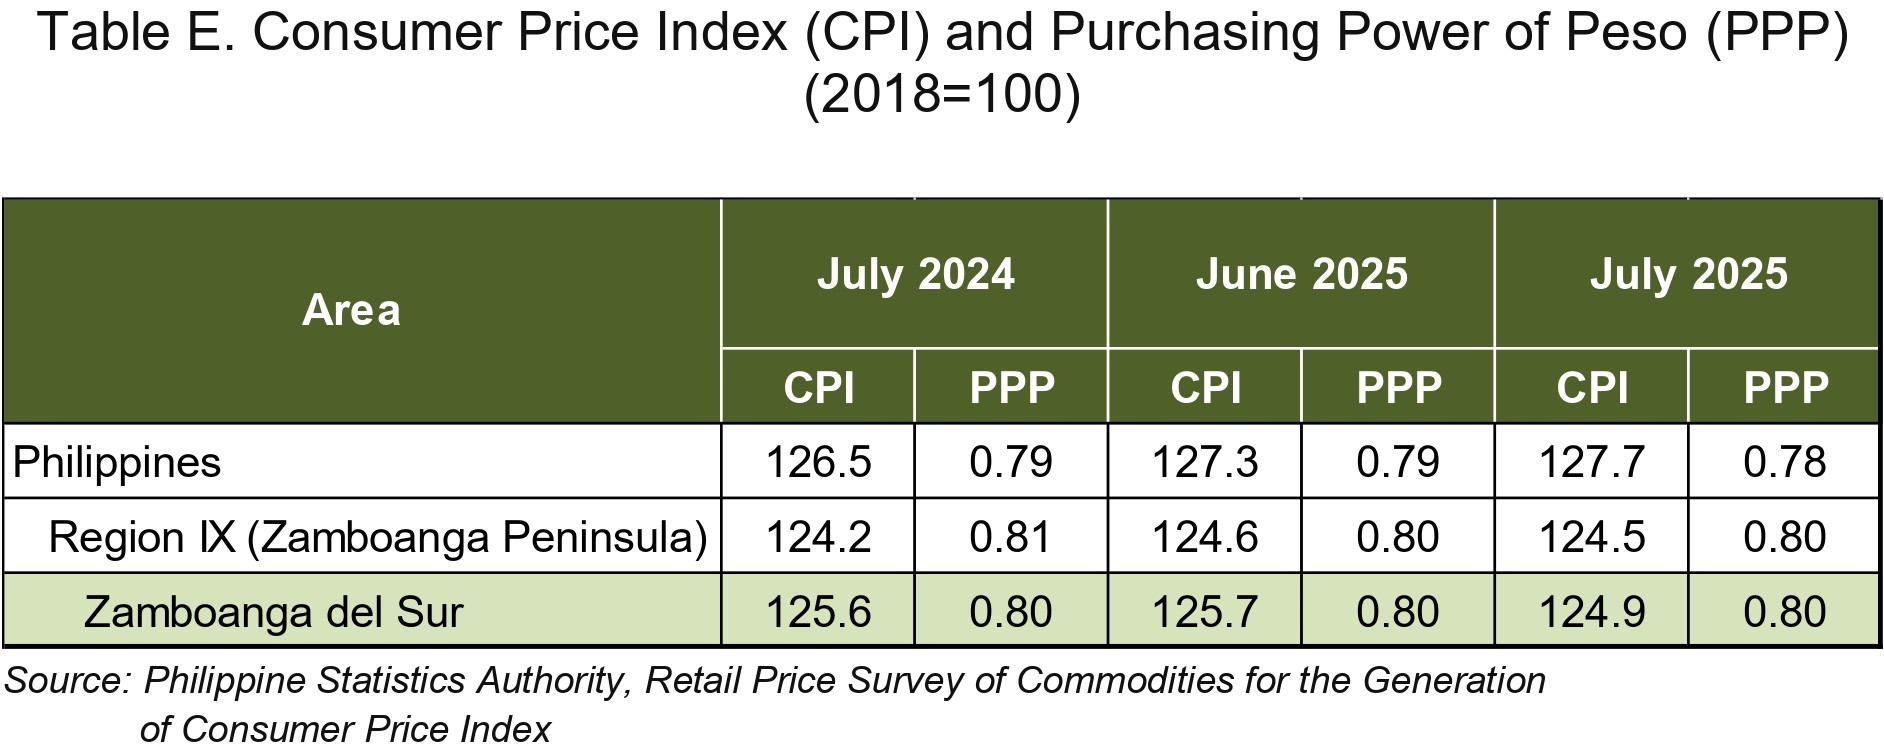
In Zamboanga del Sur, the purchasing power of the peso (PPP) in July 2025 is 0.80. This means that a peso in 2018 is worth 80 centavos in July 2025, or the amount of PhP 100.00 in 2018 is equivalent to PhP 80.00 in July 2025. An additional interpretation is that “You will need PhP 124.90 to purchase the same set of goods and services worth PhP 100.00 in 2018.” (Table E)
DIMNA P. BIENES
Chief Statistical Specialist