
Table A. Year-on-Year Inflation Rates, All Items
In Percent
(2018=100)
A. Zamboanga Peninsula
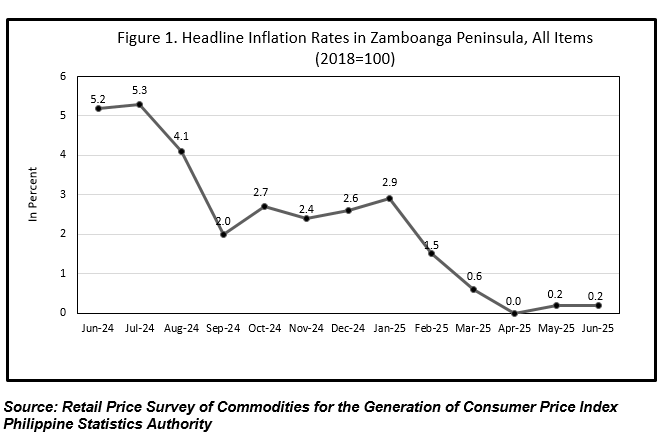
1. Headline Inflation
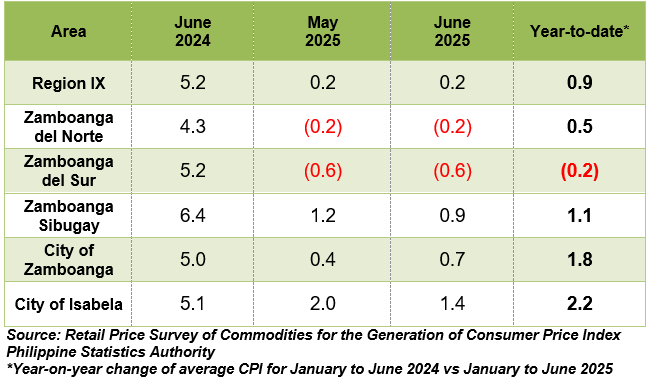
Inflation rate in Zamboanga Peninsula remained unchanged in May 2025 and June 2025, with 0.2 percent inflation, consequently bringing the region’s average inflation from June 2024 to June 2025 to 0.9 percent. In addition, the inflation recorded in June 2024 was higher at 5.2 percent (Refer to Table A and Figure 1).
The inflation was seen to remain unchanged in the Clothing and Footwear index, posting a 1.5 percent inflation in both May 2025 and June 2025. Likewise, there were minimal changes in the prices of the categories within the indices of Information and Communication at 0.1 percent, and Financial Services, which stood at 0.0 percent.
Also contributing to the overall inflation in Zamboanga Peninsula during the month of June were the higher increments in the indices of the following commodity groups as compared with their previous month’s inflation rates:
a) Furnishings, Household Equipment and Routine Household Maintenance, 3.0 percent from 2.5 percent;
b) Transport at (2.1) percent from (3.2) percent;
c) Recreation, Sport and Culture posted a 3.0 percent inflation from 2.8 percent in the previous period; and,
d) Education Services, 5.2 percent from 4.8 percent.
In contrast, lower inflation rates during the month were recorded in the following categories:
a) Food and Non-alcoholic Beverages, (1.7) percent from (1.4) percent;
b) Alcoholic Beverages and Tobacco, with 3.5 percent from 3.7 percent;
c) Housing, Water, Electricity, Gas and Other Fuels, 2.6 percent from 2.9 percent;
d) Health, 3.5 percent from 3.7 percent;
e) Restaurants and Accommodation Services, 4.3 percent from 4.4 percent; and,
f) Personal Care, and Miscellaneous Goods and Services at 1.5 percent from 1.6 percent inflation in May 2025.
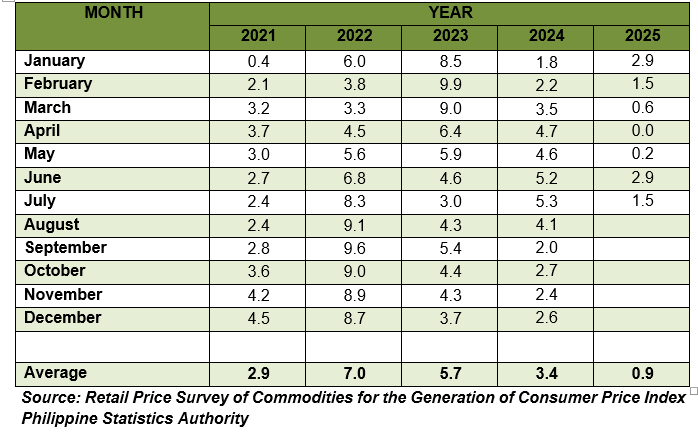
Table B. Year-on-year Inflation Rates in Zamboanga Peninsula, All items in Percent
January 2021 - January 2025
(2018=100)
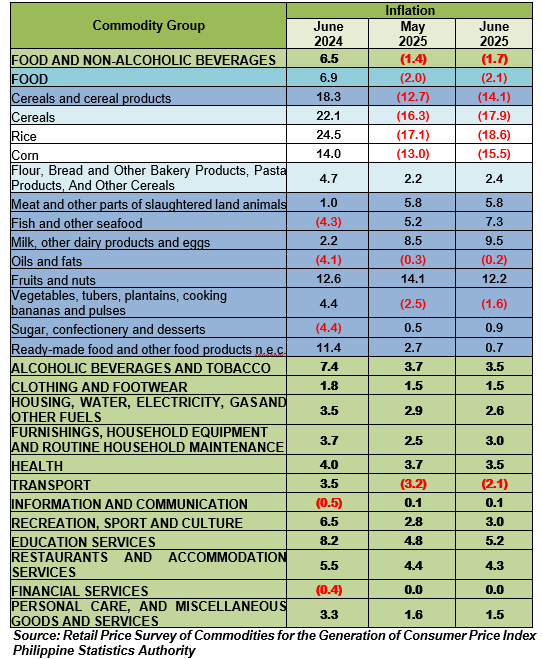
Inflation Rate by Commodity Group for All Income Households in
ZAMBOANGA PENINSULA 2018=100
Food Inflation
The monthly Food inflation for Zamboanga Peninsula further decreased in June 2025, posting (2.1) percent inflation from (2.0) percent in the previous month. On the contrary, Food inflation was higher in June 2024, with 6.9 percent inflation.
2.1 Main Drivers Behind the Downtrend of Food Inflation.
The downtrend of the inflation in the categories of Food was mainly due by the slower annual increase in the prices of Cereals and cereal products which stood at (14.1) percent from (12.7) percent inflation in the previous month. Similarly, the deceleration within the indices of Ready-made food and other food products at 0.7 percent from 2.7 percent; and, Fruits and nuts, with 12.2 percent from 14.1 percent, also contributed to the easing of inflation.
In addition, the following food groups recorded to have higher increments during the month:
a) Fish and Other Seafood, 7.3 percent from 5.2 percent;
b) Milk, and other dairy products and eggs, 9.5 percent from 8.5 percent;
c) Oils and fats, (0.2) percent from (0.3) percent;
d) Vegetables, tubers, plantains, cooking bananas and pulses at (1.6) percent in June 2025 from (2.5) percent inflation in the previous period; and,
e) Sugar, confectionery and desserts, which stood at 0.9 percent from 0.5 percent.
Meanwhile, only the index of Meat and other parts of slaughtered land animals was seen to retain its annual rate May 2025, with 5.8 percent.
Among the provinces and highly urbanized city (HUC) in the region, only Zamboanga City posted a higher inflation rate, recording 0.7 percent in June 2025. In contrast, Zamboanga Sibugay and the City of Isabela registered slower annual increments with inflation rates of 0.9 percent and 1.4 percent, respectively.
The provinces of Zamboanga del Norte and Zamboanga del Sur maintained their previous inflation rates, which stood at (0.2) percent and (0.6) percent, respectively.
Note: CPIs and inflation rates by province and selected city are posted at the PSA website (http://openstat.psa.gov.ph/).
MEWCHUN WS. PAMARAN
Regional Director
CES/MGCN/kxbl