
Release Date :
Reference Number :
250900-0191
Table A. Year-on-Year Inflation Rates,
for the Bottom 30% Income Household, All Items
In Percent
(2018=100)
a. Zamboanga City
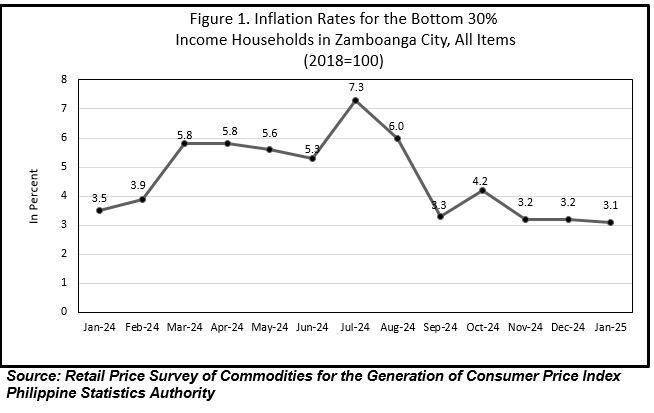
1. Inflation Rate for the Bottom 30% Income Households
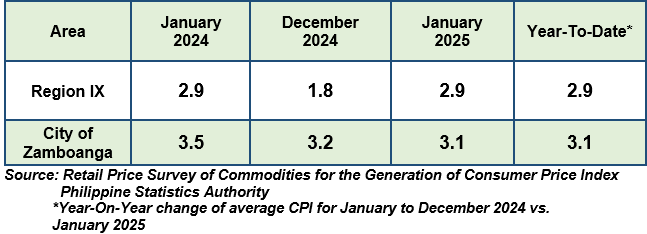
Zamboanga City’s inflation rate for the bottom 30% income bracket decelerated to 3.1 percent in January 2025 from 3.2 percent in December 2024. However, this was comparatively lower than the overall inflation rate of 3.5 percent recorded in January 2024 (Refer to Table A and Figure 1).
1.1 Main Drivers to the Downtrend of the Inflation Rate for the Bottom 30% Income Households
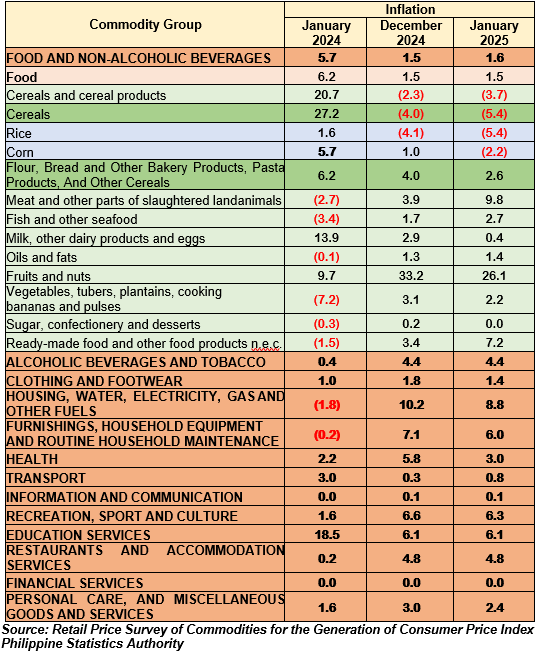
The decrease was primarily driven by the slower annual increase in Housing, Water, Electricity, Gas and Other Fuels, which decelerated to 8.8 percent from 10.2 percent in the previous month. In addition, the decline in prices within the indices of Health, with 3.0 percent from 5.8 percent inflation, and in Personal Care, and Miscellaneous Goods and Services at 2.4 percent from 3.0 percent, also contributed to the downtrend in the inflation rate for the bottom 30% income households in the city.
Lower increments were also observed in the following commodity groups:
a. Clothing and Footwear, with 1.4 percent from 1.8 percent inflation in December 2024;
b. Furnishings, Household Equipment, and Routine Household Maintenance at 6.0 percent from 7.1 percent; and,
c. Recreation, Sport and Culture, 6.3 percent from 6.6 percent.
In comparison, there were notable increases in the annual growth rates within the indices of Food and Non-alcoholic Beverages, 1.6 percent from 1.5 percent inflation, and Transport, which stood at 0.8 percent from 0.3 percent inflation.
Meanwhile, the following commodity groups retained their previous month’s inflation rates:
a. Alcoholic Beverages and Tobacco, 4.4 percent;
b. Information and Communication, 0.1 percent;
c. Education Services, 6.1 percent;
d. Restaurants and Accommodation Services, 4.8 percent; and,
e. Financial Services at 0.0 percent inflation.
1.2 Main Contributors to the Inflation Rate for the Bottom 30% Income Households
The top three (3) commodity groups contributing to the January 2025 inflation rate for the bottom 30% were the following:
a) Housing, Water, Electricity, Gas and Other Fuels, contributing 48.2 percent share or 1.5 percentage points;
b) Food and Non-alcoholic Beverages with 30.4 percent share or 0.9 percentage point; and,
c) Restaurants and Accommodation Services, contributing 7.4 percent share or
0.2 percentage point.
Table B. Year-on-year Inflation Rates for the Bottom 30% Income Households
in Zamboanga City, All items in Percent
January 2021 to January 2025
(2018=100)
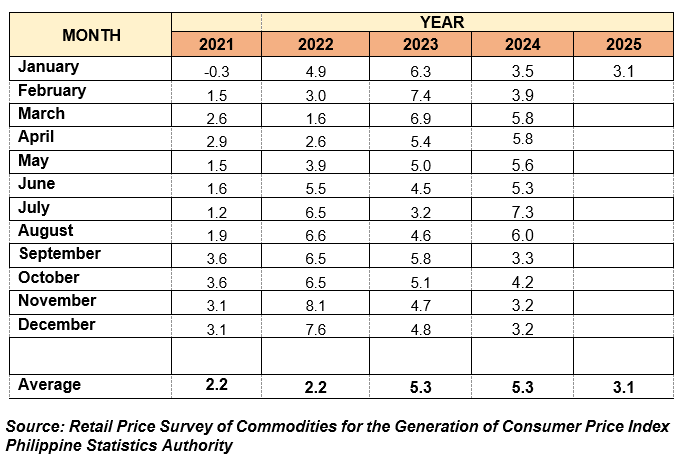
Table C. Inflation Rate by Commodity Group for the Bottom 30% Income Households in
ZAMBOANGA CITY
2018=100
2. Food Inflation
A stable inflation was observed in the monthly Food inflation for the bottom 30% Income Households in Zamboanga City, which remained at 1.5 percent in both December 2024 and January 2025. This was lower than the recorded Food inflation in January 2024, which stood at 5.7 percent inflation.
Meanwhile, slower inflation was observed in the following food commodities:
a. Milk, other dairy products and eggs, with 0.4 percent from 2.9 percent;
b. Fruits and nuts, which stood at 26.1 percent from 33.2 percent;
c. Vegetables, tubers, plantains, cooking bananas and pulses, 2.2 percent from 3.1 percent; and,
d. Sugar, confectionery and desserts, 0.0 percent from 0.2 percent inflation in December 2024.
On the contrary, an increase in prices were recorded in the following food commodities:
a. Meat and other parts of slaughtered land animals at 9.8 percent from 3.9 percent;
b. Fish and other seafood, 2.7 percent from 1.7 percent inflation;
c. Oils and fats, 1.4 percent from 1.3 percent; and,
d. Ready-made food and other food products n.e.c., 7.2 percent from 3.4 percent inflation.
2.2 Main Contributors to the Food Inflation
Food inflation contributed 28.7 percent share or 0.9 percentage point to the overall inflation for the Bottom 30% Income Households in Zamboanga City. Moreover, the top three (3) Food groups contributing to the January 2025 food inflation were the following:
a) Meat and other parts of slaughtered land animals, contributing 89.0 percent share or 1.3 percentage point;
b) Fruits and nuts, contributing 68.6 percent share or 1.0 percentage points; and,
c) Fish and other seafood with 53.1 percent share or 0.8 percentage point.
__________________________________________________________________________
Note: CPIs and inflation rates for the bottom 30% income households by region and by province and selected city are posted at the PSA website (http://openstat.psa.gov.ph/).
MEWCHUN WS. PAMARAN
Regional Director
MFET/kxbl