
Release Date :
Reference Number :
SR-2025ZN-007
Table A. Year-on-Year Inflation Rates, All Items
In Percent (2018=100)
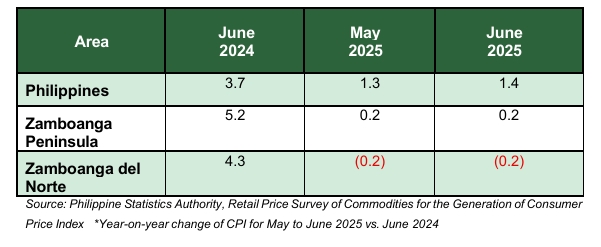
Overall Inflation
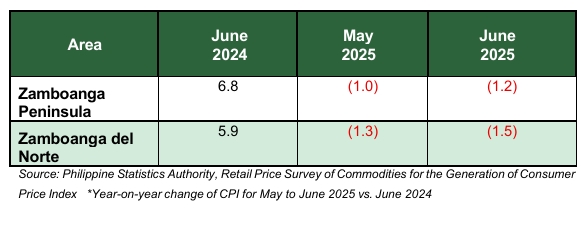
Zamboanga del Norte’s inflation rate for all-income households remained at -0.2 percent in June 2025 as it recorded the same annual growth in May 2025. This is a notable decrease compared to the 4.3 percent recorded in June 2024. Similarly, the Zamboanga Peninsula's inflation rate also held steady at -0.2 percent in June 2025, down sharply from 5.2 percent in the same month last year (Table A).
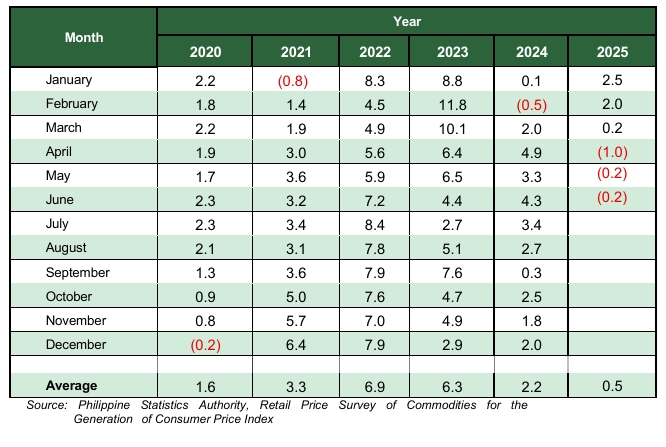
Table B. Year-on-Year Inflation Rates in Zamboanga del Norte, All Items January 2020 to June 2025
in Percent (2018=100)
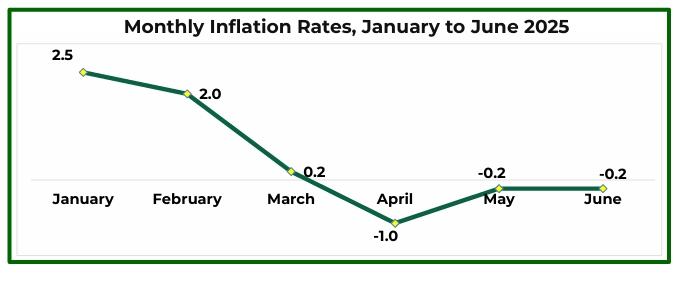
Graph 1. Inflation Rates for all-income households in Zamboanga del Norte, January 2025 to June 2025 by Commodity Group
Varied annual growth rates in the indices of the commodity groups were observed in June 2025.
The commodity groups that retained their previous month’s inflation rates in June 2025 were as follows:
- Clothing and Footwear, at 2.6 percent;
- Information and Communication, at 0.1 percent;
- Recreation, Sport and Culture, at 5.1 percent;
- Education Services, at 3.9 percent;
- Restaurants and Accommodation Services, at 5.6 percent; and
- Financial Services, at 0.0 percent.
In addition, the following commodity groups registered lower inflation rates during the month of June 2025 were:
- Food and Non-Alcoholic Beverages, -1.6 percent from -1.3 percent;
- Alcoholic Beverages and Tobacco, 5.0 percent from 5.4 percent;
- Housing, Water, Electricity, Gas and Other Fuels, -0.2 percent from 0.2; and
- Health, 5.1 percent from 5.3 percent.
In contrast, the following commodity groups registered higher inflation rates during the month:
- Furnishings, Household Equipment and Routine Household Maintenance, 1.5 percent from 1.4 percent;
- Transport, -2.2 percent from -3.8 percent; and
- Personal Care, and Miscellaneous Goods and Services, 2.2 percent from 2.1 percent.
Main Contributors to the Headline Inflation
The top three commodity groups contributing to the June 2025 overall inflation were the following:
- Food and Non-Alcoholic Beverages with -1.6 percent inflation at 294.1 percent share of the overall inflation;
- Transport with -2.2 percent inflation at 69.7 percent share of the overall inflation; and
- Housing, Water, Electricity, Gas and Other Fuels with -0.2 percent inflation at 9.4 percent share of the overall inflation.
Top 5 Contributors in Zamboanga del Norte June 2025 Inflation:
- Rice with -16.4 percent inflation from -12.8 percent in the previous month;
- Corn with -22.6 percent inflation from -18.5 percent in the previous month;
- Gasoline, with -7.8 percent inflation from -12.9 percent in the previous month;
- Electricity from all sources with -5.2 percent inflation from -3.3 percent in the previous month; and
- Other fish, live, fresh, chilled, or frozen, with -8.5 percent inflation from -1.8 percent in the previous month.
Table C. Year-on-Year Inflation Rates in Zamboanga del Norte, All Items June 2024, May to June 2025 by Commodity Group
In Percent (2018=100)
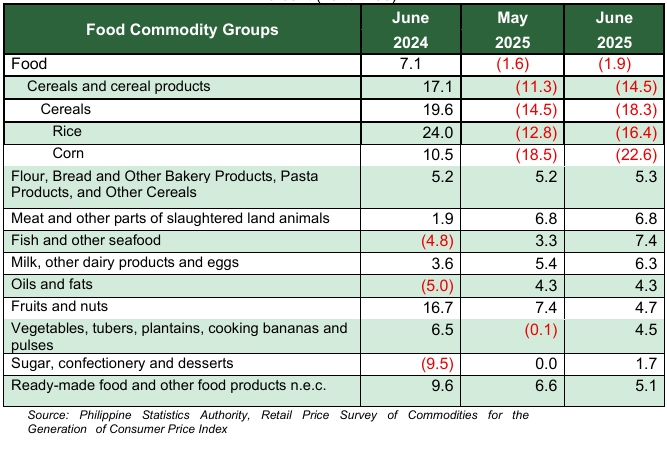
Food Inflation
Food inflation in Zamboanga del Norte for June 2025 further declined to -1.9 percent from -1.6 percent in May 2025. On the other hand, the food inflation in June 2024 was higher at 7.1 percent (Table C).
The Main Drivers Behind the Downtrend of Food Inflation
The downtrend in food inflation for June 2025 was mainly driven by slower annual growth rates in several key food groups. Cereals inflation rate further declined, recording -18.3 percent compared to -14.5 percent in the previous month. Similarly, inflation for Fruits and nuts eased to 4.7 percent from 7.4 percent, while Ready-made food and other food products n.e.c. declined to 5.1 percent from 6.6 percent (Table C).
Table D. Year-on-Year Inflation Rates, for the Bottom 30% Income Household, All Items
In Percent (2018=100)
Bottom 30% Income Household
Zamboanga del Norte's inflation rate for the bottom 30% income households further declined to 1.5 percent in June 2025 from a drop of 1.3 percent in May 2025. In comparison, the inflation rate in June 2024 was significantly higher at 5.9 percent (Table D).
Main Sources of Deceleration
The main sources of deceleration to the June 2025 bottom 30% were the following:
- Food and Non-Alcoholic Beverages with -3.6 percent inflation at 83.8 percent share to down trend inflation; and
- Housing, Water, Electricity, Gas and Other Fuels with 0.4 percent inflation at 12.3 percent share to down trend inflation.
Top 5 Contributors in Zamboanga del Norte, June 2025 Inflation for the bottom 30%:
- Rice with -16.6 percent inflation from -12.9 percent in the previous month;
- Corn with -22.6 percent inflation from -18.5 percent in the previous month;
- Gasoline with -7.8 percent inflation from -12.9 percent in the previous month;
- Electricity from all sources with -5.2 percent inflation from -3.3 percent in the previous month; and
- Cephalopods, live, fresh, chilled, or frozen with -22.2 percent inflation from -17.9 percent in the previous month.
Purchasing Power of Peso
In Zamboanga del Norte, the purchasing power of the peso was recorded at Php 0.80, which explains that you needed Php 124.6 for a basket of food and non-food commodities in June 2025, which only cost Php 100.00 in the year 2018.
Technical Notes:
Consumer Price Index (CPI)
The CPI is an indicator of the change in the average prices of goods and services commonly purchased by consumers.
Uses of CPI
The CPI is most widely used in the calculation of the inflation rate and the purchasing power of peso. It is a major statistical series used for economic analysis and as a monitoring indicator of government economic policy.
Computation of CPI
The computation of the CPI involves consideration of the following important points:
- Base Period - The base year is a reference period, usually a year, at which the index number is set to 100. It is the reference point of the index number series. The CPI is rebased from the base year 2012 to the base year 2018.
- Market Basket - Market basket refers to a sample of goods and services commonly purchased by households.
- Weighting System - The weighting pattern uses the expenditures on various consumer items purchased by households as a proportion of total expenditure.
- Formula - The 2018-based CPI series use the same method of computation as the 2012-based CPI series, which is the Chained Laspeyres formula.
- Geographic Coverage - CPI values are computed at the national, regional, provincial levels, and Highly Urbanized Cities.
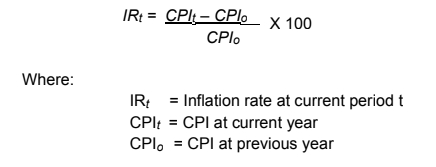
Inflation Rate (IR)
The rate of change of the CPI expressed in percent, Inflation is interpreted in terms of the declining purchasing power of peso.
It is computed using the following formula;
Headline Inflation
Refers to the rate of change in the CPI, a measure of the average standard basket of goods and services consumed by a typical family.
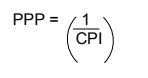
Purchasing Power of Peso (PPP)
Shows how much the peso in the base period is worth in the current period. It is computed by getting the reciprocal of the CPI and multiplying the result by 100 as follows:
How does the PSA compile the CPI for the bottom 30% income households?
The CPI for the bottom 30 % income households is compiled by the PSA to measure the changes of prices of commodities commonly purchased by families that belong to the bottom 30% income decile. The process of price collection and CPI computation is the same as that of the CPI for all income households. However, there is a separate market basket and weights for the CPI for the bottom 30% income households.
ANDRES S. TAPALES, JR.
(Statistical Specialist II)
Officer-In-Charge
| Attachment | Size |
|---|---|
|
|
321.14 KB |