
Release Date :
Reference Number :
250900 - 0668
Table A. Year-on-Year Inflation Rates for Zamboanga Peninsula and Zamboanga City, All Items
In Percent
(2018=100)
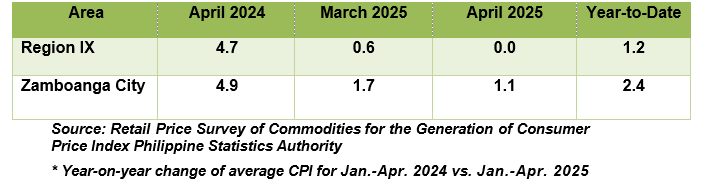
A. Zamboanga City
a. Overall Inflation Rate
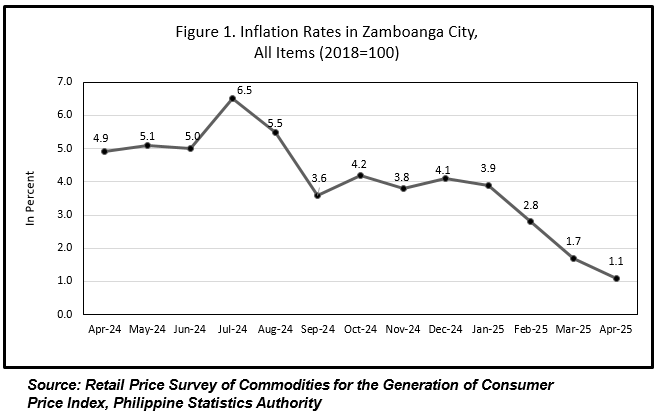
Headline inflation for Zamboanga City decreased further to 1.1 percent in April 2025 from 1.7 percent in March 2025. In April 2024, the inflation rate was comparatively higher at 4.9 percent. This brings the year-to-date inflation in the city to 2.4 percent (Refer to Table A and Figure 1).
1.1 Main Drivers Behind the Downtrend of the Overall Inflation Rate for Zamboanga City
The main drivers on the downtrend of the overall inflation in April 2025 was primarily driven by the slower annual increment of the commodity group, Food and Non-Alcoholic Beverages, which stood at 0.1 percent from 0.7 percent inflation in March 2025. In addition, the decrease in prices in the indices of Transport at (5.6) percent from (3.4) percent, and Restaurants and Accommodation Services, with 1.2 percent from 2.7 percent also contributed to the decrease of the overall inflation rate in Zamboanga City.
In addition, lower annual increments were also observed in the following commodity
groups:
a. Personal Care, and Miscellaneous Goods and Services, 0.9 percent from 1.9 percent;
b. Housing, Water, Electricity, Gas and Other Fuels, 5.0 percent from 5.2 percent;
c. Recreation, Sport and Culture, 1.7 percent from 2.8 percent;
d. Health, 2.6 percent from 2.8 percent;
e. Information and Communication, 0.0 percent from 0.1 percent:
f. Furnishings, Household Equipment, and Routine Household Maintenance, 3.3 percent from 3.4 percent;
Meanwhile, the following commodity groups retained their previous month’s inflation rates:
a. Alcoholic Beverages and Tobacco, 0.7 percent;
b. Clothing and Footwear, 0.8 percent;
c. Education Services, 5.8 percent;
d. Financial Services, 0.0 percent;
1.2 Main Contributors to the Overall Inflation Rate
The top three (3) commodity groups contributing to the overall inflation rate in Zamboanga City were the following:
a. Housing, Water, Electricity, Gas and Other Fuels, contributing 96.9 percent share or 0.09 percentage points;
b. Education services, contributing 7.9 percent share or 0.09 percentage points;
c. Restaurants and Accommodation Services 6.8 percent share or 0.07 percentage points;
Table B. Year-on- Year Inflation Rates in Zamboanga City, All Items, In percent
January 2021 – April 2025
(2018=100)
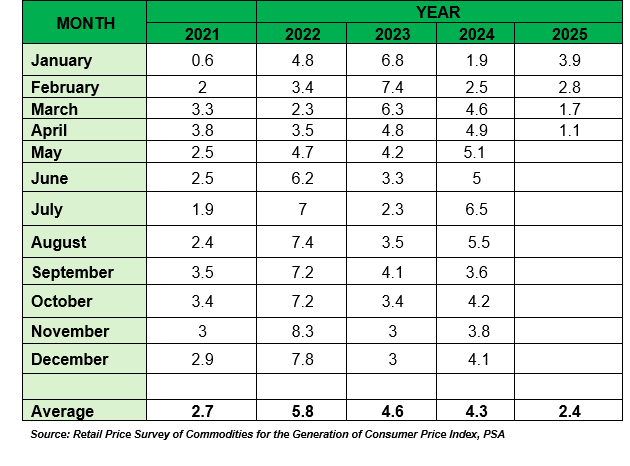
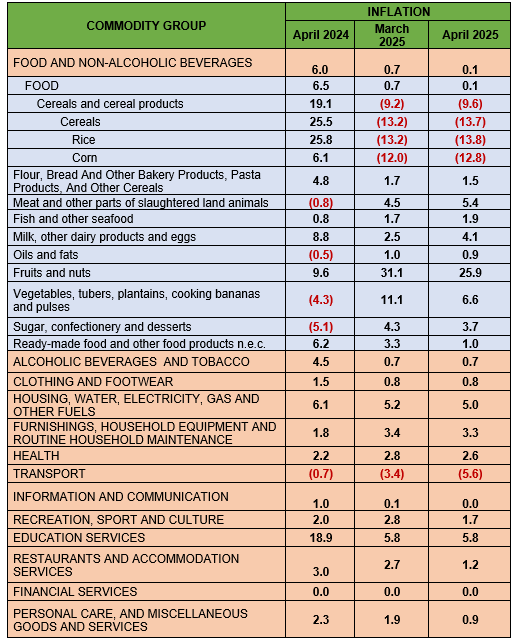
Table C. Year-On-Year Inflation Rates by Commodity Groups in Zamboanga City for all Income Households, 2018=100
Food Inflation
Food inflation in Zamboanga City for April 2025 declined further to 0.1 percent from 0.7 percent in March 2025. On the other hand, the food inflation in April 2024 was higher, which stood at 6.0 percent inflation.
1.1 The Main Drivers Behind the Downtrend of Food Inflation
The main drivers in the downtrend of food inflation in April 2025 was brought by the slower annual growth rate of the food index of Vegetables, tubers, plantains, cooking bananas and pulses, which recorded 6.6 percent from 11.1 percent inflation during the previous month. In addition, the decrease in prices of the food indices of Rice at (13.8) percent from (13.2) percent inflation, and Fruits and nuts, at 25.9 percent from 31.1 percent also contributed to the lower food inflation. In addition, lower annual increments were also observed in the following food commodity
groups:
a. Cereals and cereal products, (9.6) percent from (9.2) percent;
b. Cereals (ND), (13.7) percent from (13.2) percent;
c. Ready-made food and other food products n.e.c, 1.0 percent from 3.3 percent;
d. Sugar, confectionery and desserts, 3.7 percent from 4.3 percent;
e. Oils and fats, 0.9 percent from 1.0 percent;
f. Corn, (12.8) percent from (12.0) percent;
g. Flour, bread and other bakery products, pasta products, and other cereals, 1.5 percent from
1.7 percent;
On the contrary, higher year-on-year growth rates were observed in the following food commodities:
a. Meat and other parts of slaughtered land animals, 5.4 percent from 4.5 percent;
b. Fish and other seafood (ND), at 1.9 percent from 1.7 percent;
c. Milk, other dairy products and eggs (ND), 4.1 percent from 2.5 percent;
Note: CPIs and inflation rates by province and selected city are posted at the PSA website
MEWCHUN WS. PAMARAN
Regional Director
RRM/mgcn
| Attachment | Size |
|---|---|
|
|
274.27 KB |