Release Date :
Reference Number :
SR-ZDS-2024-008
1. Headline Inflation
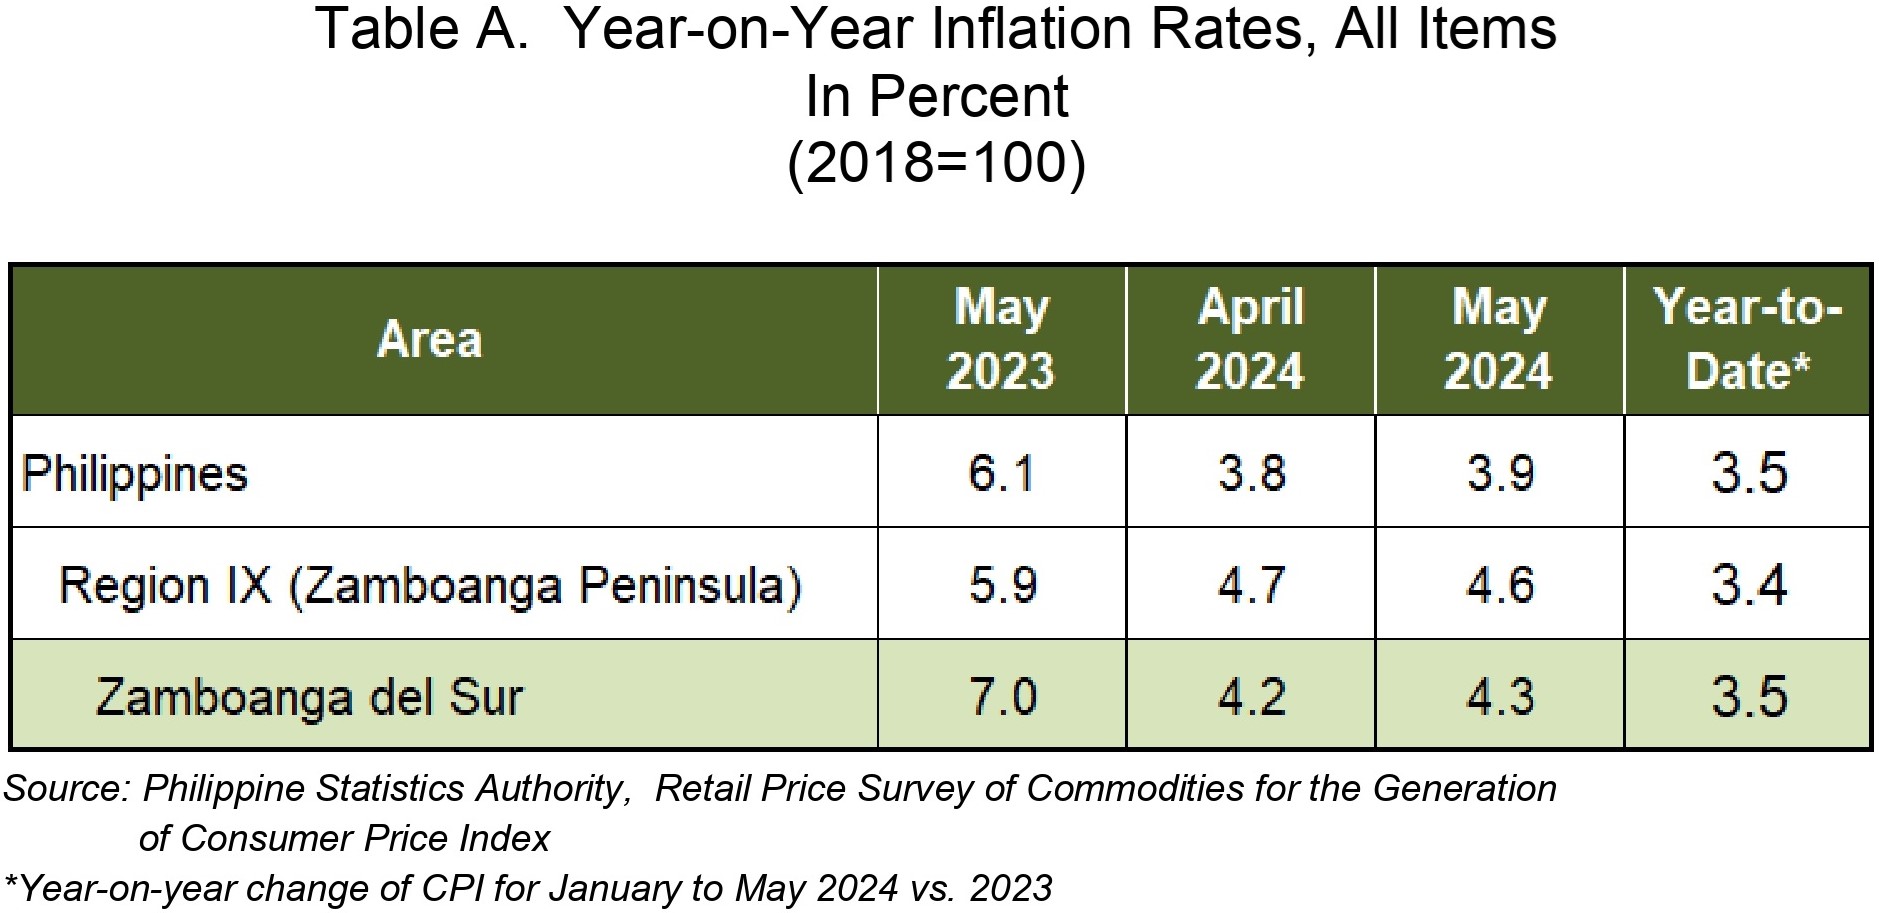
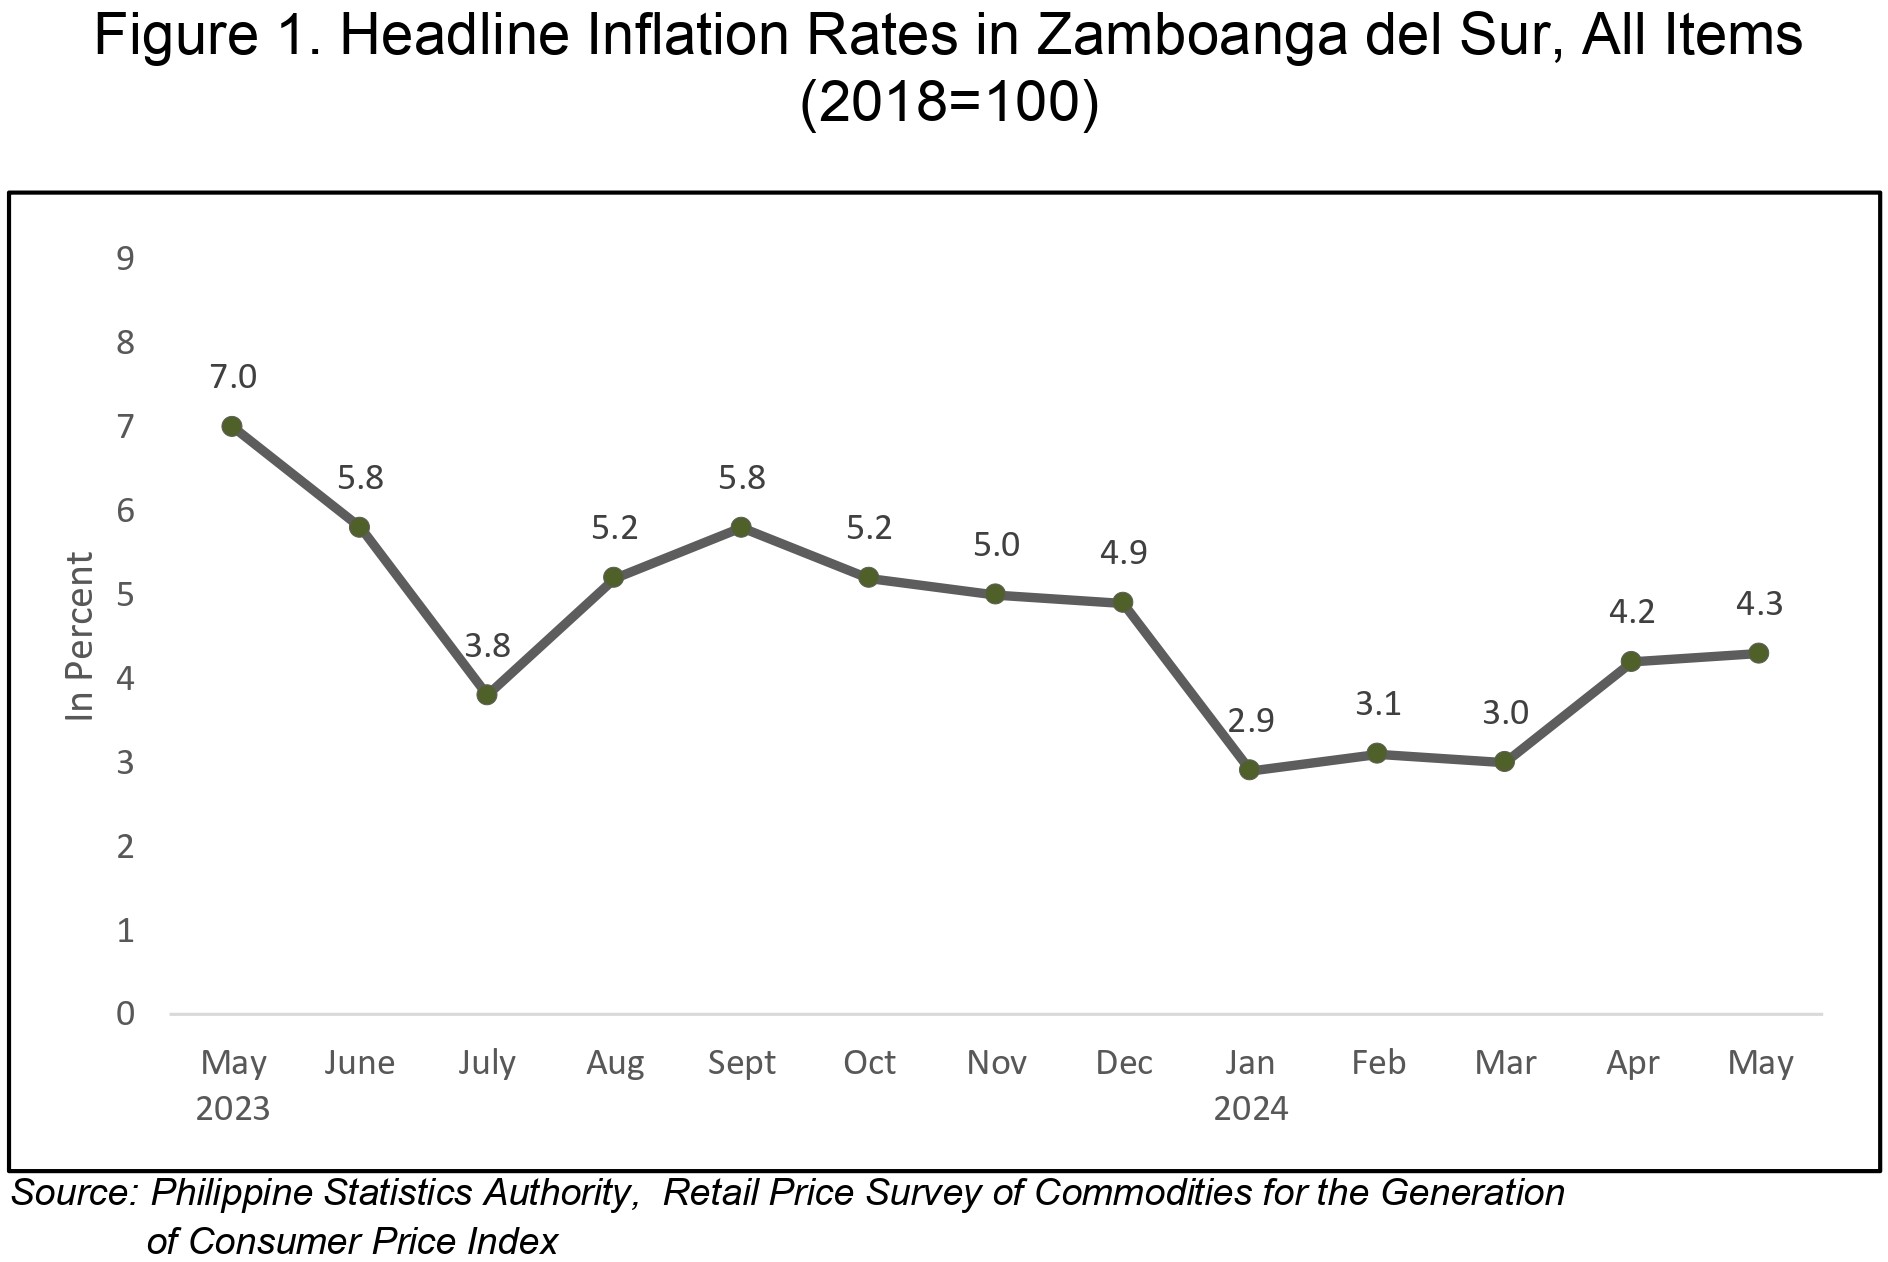
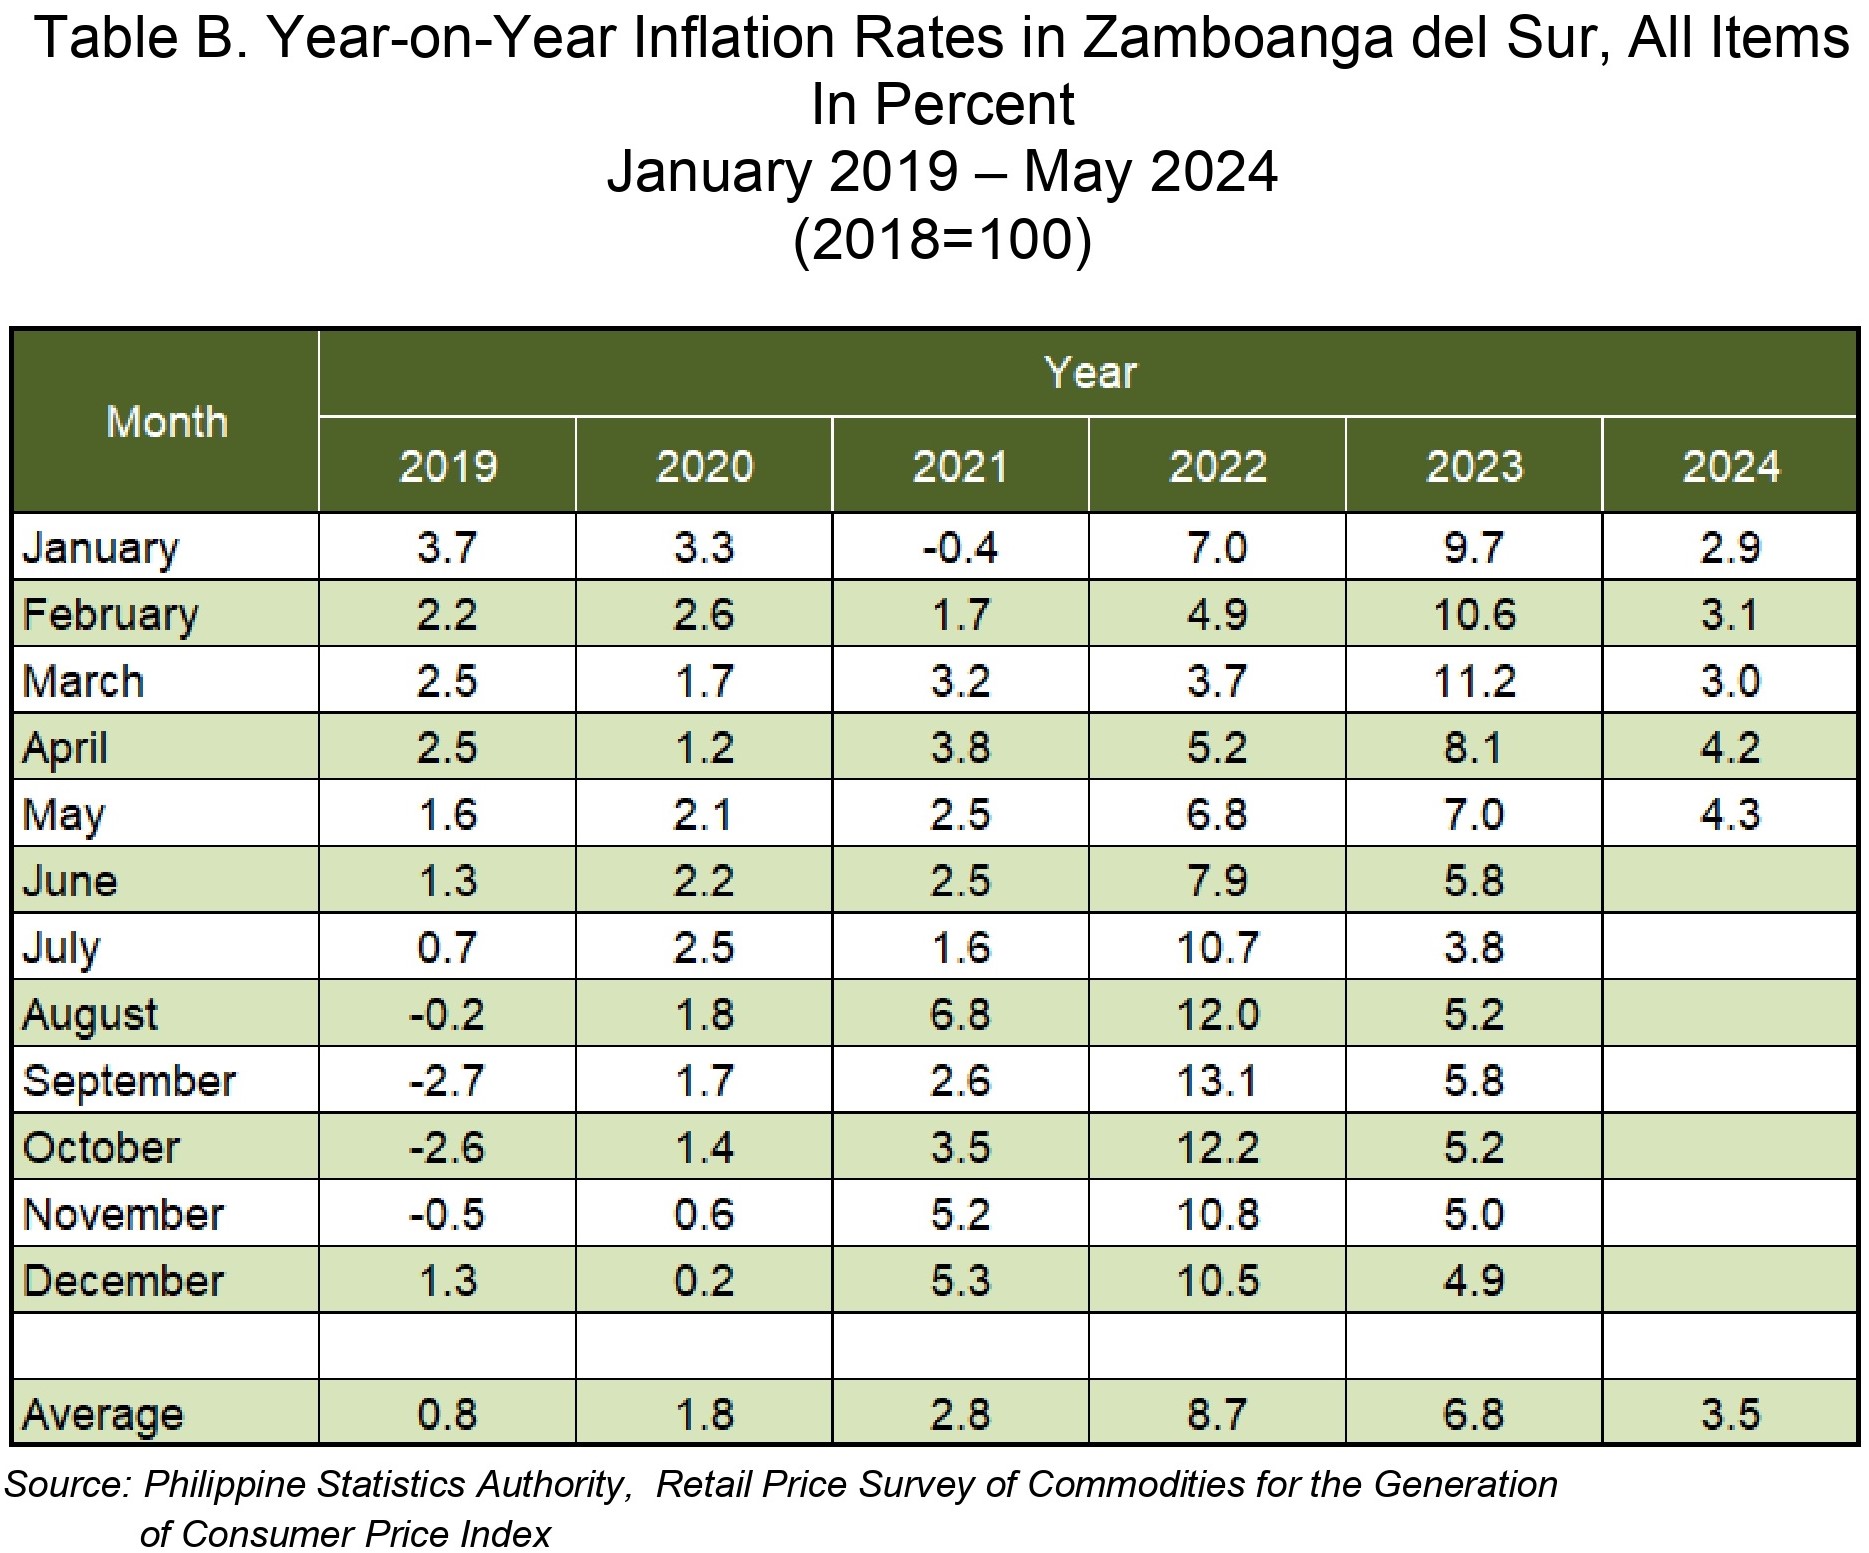
Zamboanga del Sur’s headline inflation or overall inflation increased to 4.3 percent in May 2024 from 4.2 percent in April 2024. This brings the province’s average inflation from January 2024 to May 2024 to 3.5 percent. In May 2023, the inflation rate was higher at 7.0 percent. (Tables A and B, and Figure 1)
1.1 Main Drivers to the Uptrend of the Headline Inflation
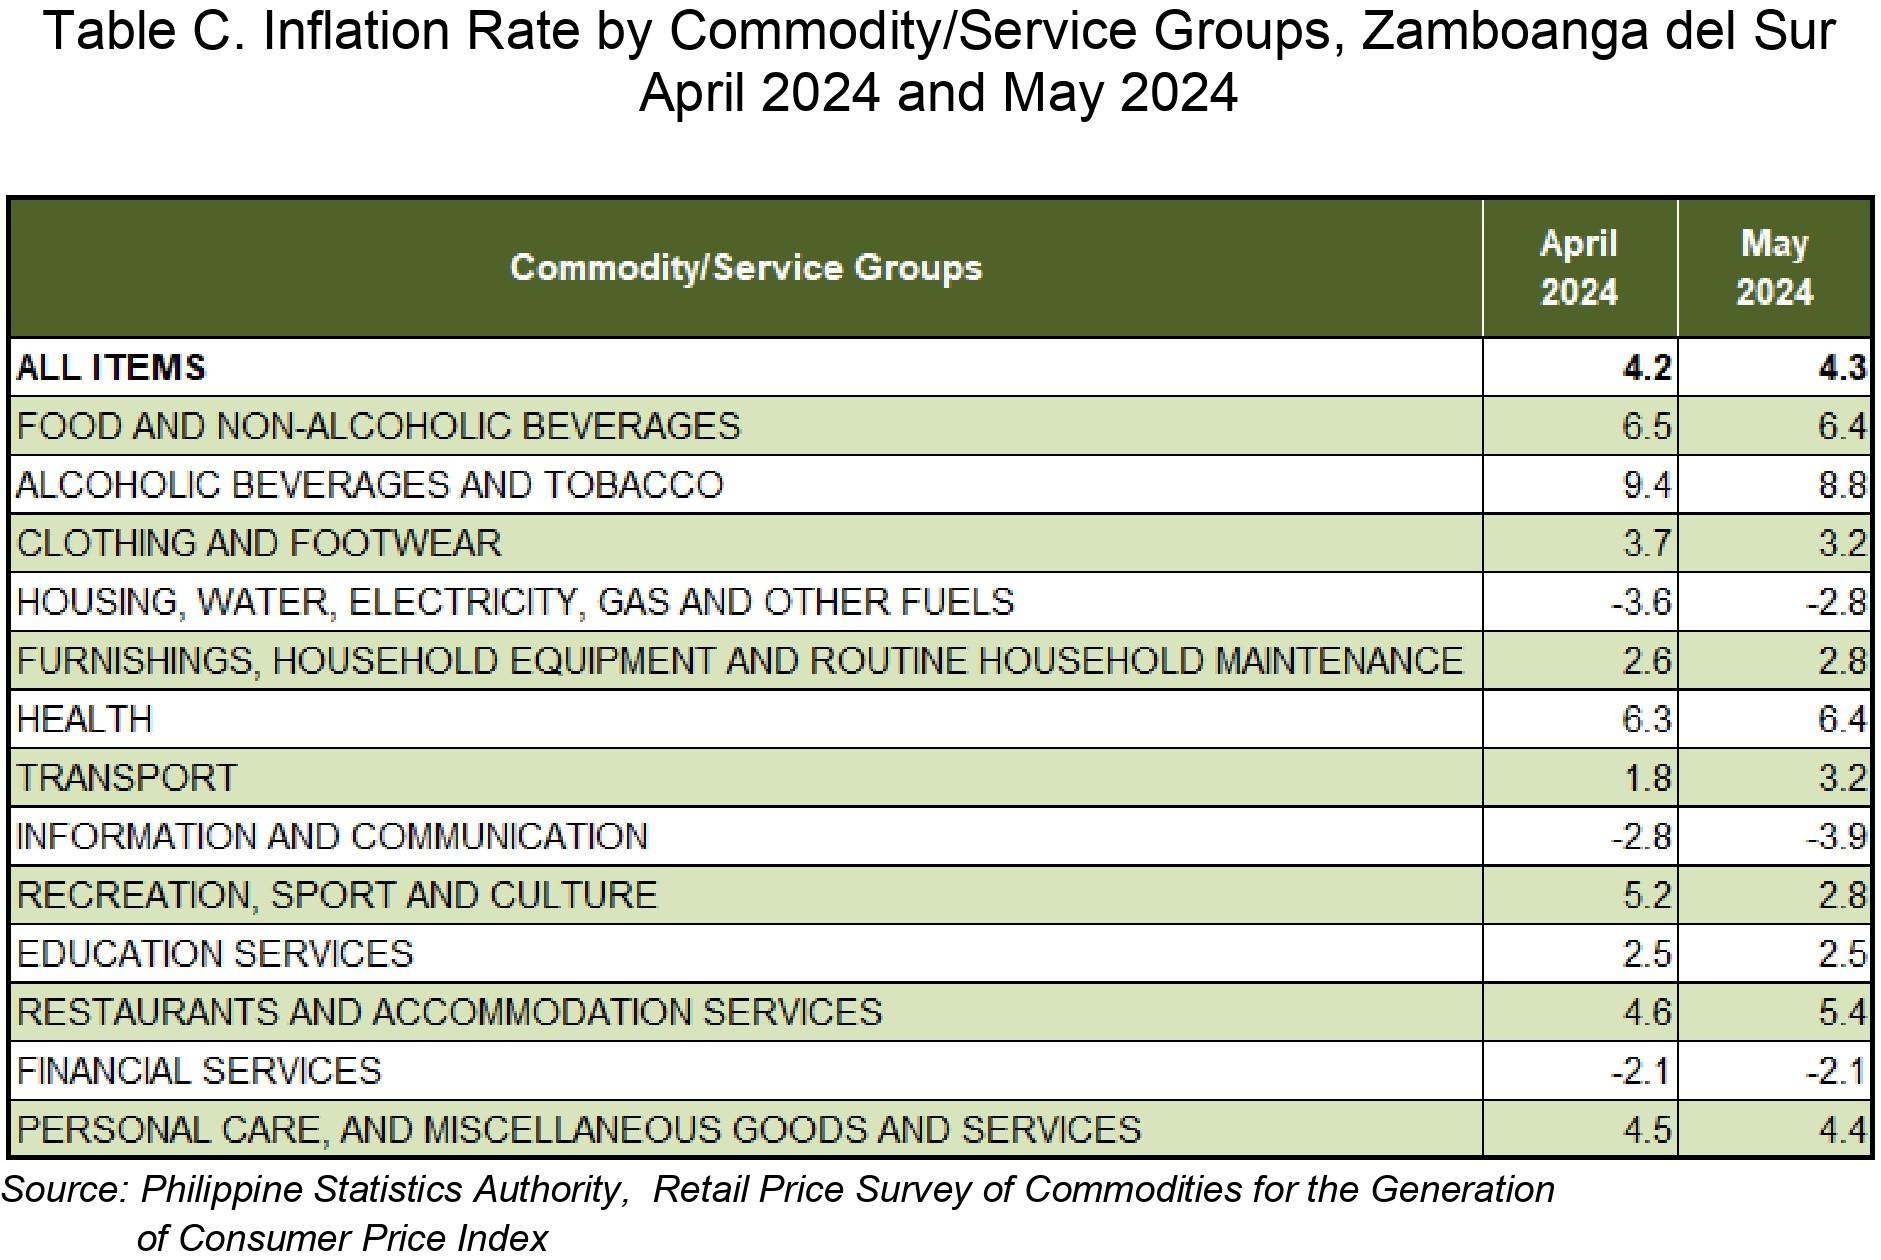
The uptrend in inflation in May 2024 was primarily influenced by the slower year-on-year decline of housing, water, electricity, gas, and other fuels which registered an annual decrease of 2.8 percent in May 2024 from an annual decline of 3.6 percent in the previous month. The higher year-on-year increase of transport at 3.2 percent during the month from an annual growth of 1.8 percent in April 2024 also contributed to the uptrend. Moreover, restaurants and accommodation services also contributed to the uptrend as it recorded an annual increase of 5.4 percent during the month from an annual rise of 4.6 percent in April 2024.
In addition, higher annual increments were also noted in the indices of the following commodity groups:
a. Furnishings, household equipment and routine household maintenance, 2.8 percent; and
b. Health, 6.4 percent.
In contrast, six commodity groups registered lower inflation rates during the month:
a. Alcoholic beverages and tobacco, 8.8 percent from 9.4 percent;
b. Food and non-alcoholic beverages, 6.4 percent from 6.5 percent;
c. Personal care, and miscellaneous goods and services, 4.4 percent from 4.5 percent;
d. Clothing and footwear, 3.2 percent from 3.7 percent;
e. Recreation, sport and culture, 2.8 percent from 5.2 percent; and
f. Information and communication, -3.9 percent from -2.8 percent.
The indices of education services; and financial services retained their previous month’s annual increment. (Table C)
1.2 Main Contributors to the Headline Inflation
The top three commodity groups contributing to the May 2024 overall inflation were the following:
a. Food and non-alcoholic beverages with 82.8 percent share or 3.56 percentage points;
b. Restaurants and accommodation services with 5.6 percent share or 0.24 percentage points; and
c. Personal care, and miscellaneous goods and services with 4.7 percent share or 0.20 percentage points.
2.0 Food Inflation
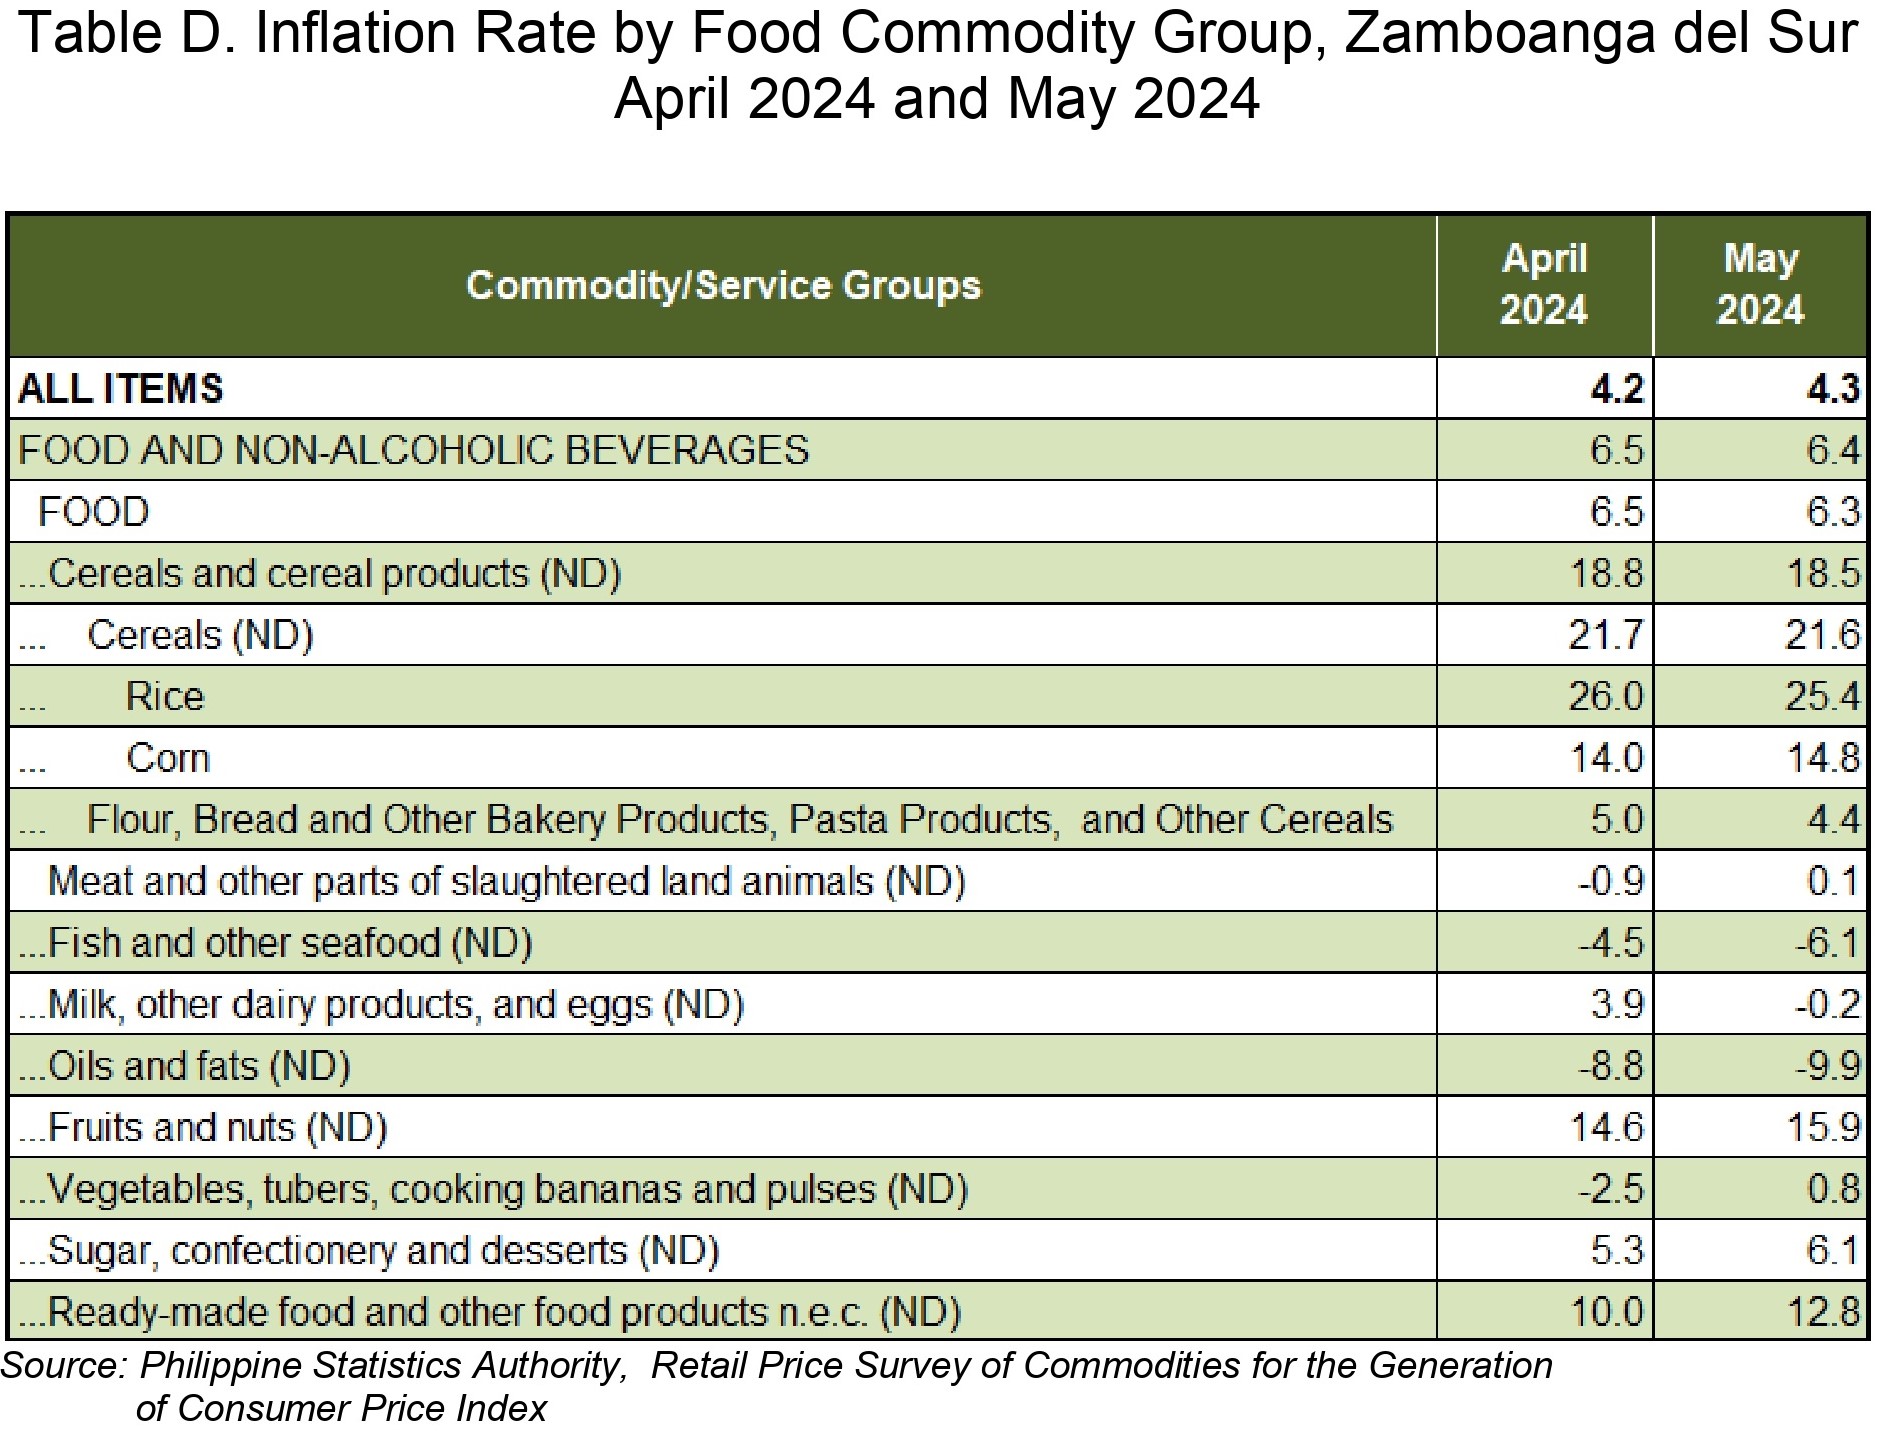
Food inflation in the province decreased to 6.3 percent in May 2024 from 6.5 percent in the previous month.
2.1 Main Drivers to the Downward Trend of Food Inflation
The deceleration of food inflation in May 2024 was primarily brought about by the faster year-on-year decline in the index of fish and other seafood which recorded a decline of 6.1 percent in May 2024 from a decrease of 4.5 percent in the previous month. In addition, milk, other dairy products and eggs index recorded an annual decline of 0.2 percent from an annual increase of 3.9 percent. Also contributing to the downtrend of food inflation is cereals and cereal products which recorded a slower year-on-year increase of 18.5 percent from an increase of 18.8 percent.
Moreover, lower annual increments were also noted in the index of oils and fats which recorded a decline of 9.9 percent from a decrease of 8.8 percent in the previous month.
On the contrary, higher year-on-year growths were observed in the indices of fruits and nuts (15.9 percent from 14.6 percent); ready-made food and other food products (12.8 percent from 10.0 percent); sugar, confectionery and desserts (6.1 percent from 5.3 percent); vegetables, tubers, plantains, cooking bananas and pulses (0.8 percent from -2.5 percent); and meat and other parts of slaughtered land animals (0.1 percent from -0.9 percent). (Table D)
2.2 Main Contributors to the Food Inflation
Food inflation shared 77.7 percent or 3.34 percentage points to the overall inflation in May 2024. The top three food groups in terms of contribution to food inflation during the month were the following:
a. Cereals and cereal products, which include rice, corn, flour, bread and other bakery products, pasta products, and other cereals, with 104.5 percent or 6.59 percentage points;
b. Fruits and nuts with 6.8 percent or 0.43 percentage points; and
c. Ready-made food and other food products with 4.9 percent or 0.31 percentage points. (Table D)
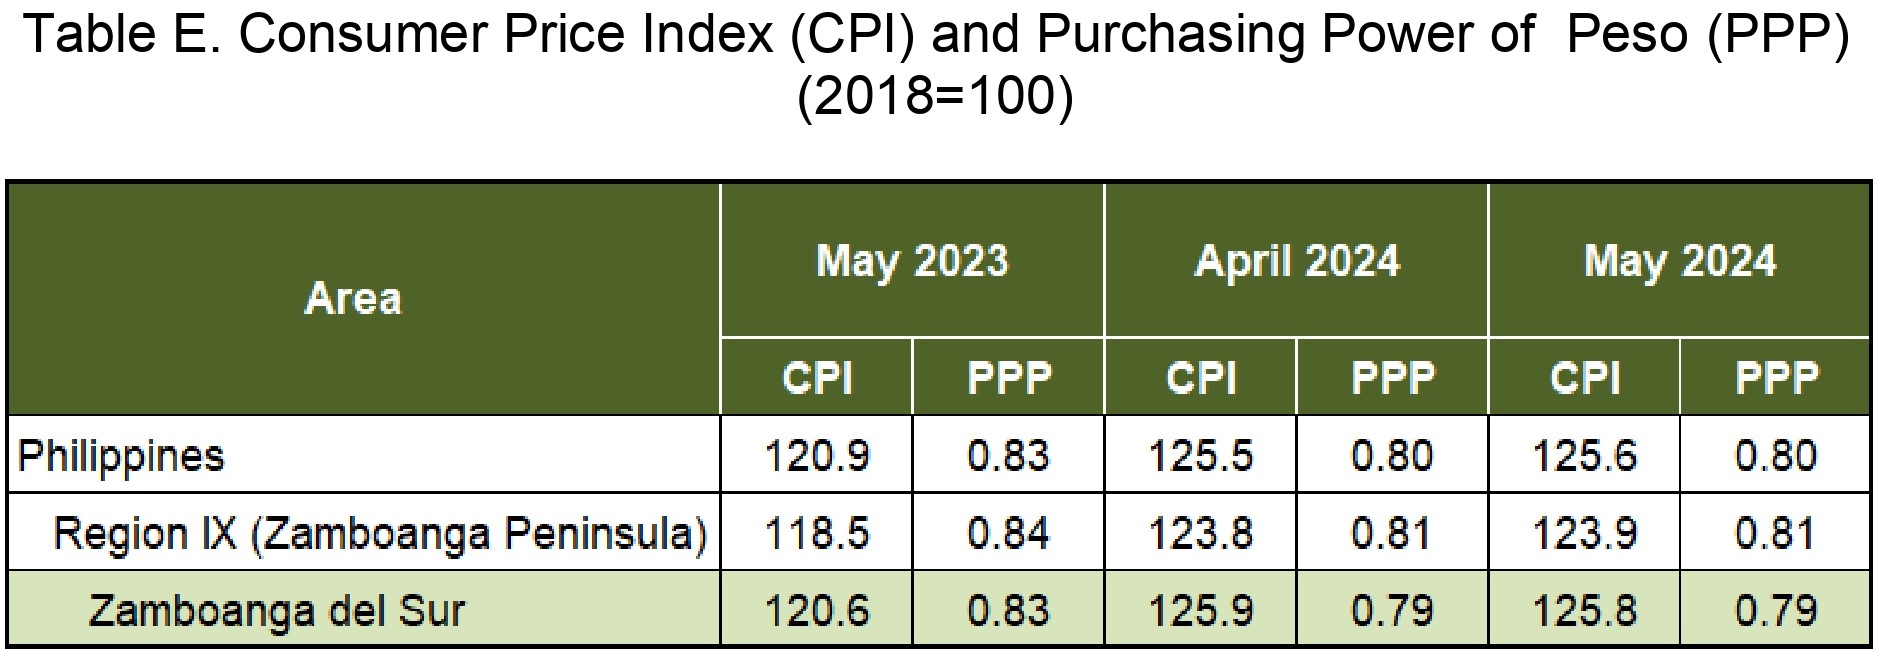
In Zamboanga del Sur, the purchasing power of the peso (PPP) in May 2024 remains at 0.79. This means that a peso in 2018 is worth 79 centavos in May 2024, or the amount of PhP 100.00 in 2018 is equivalent to PhP 79.00 in May 2024. An additional interpretation is that “You will need PhP 125.80 to purchase the same set of goods and services worth PhP 100.00 in 2018.” (Table E)
DIMNA P. BIENES
(Supervising Statistical Specialist)
Officer-in-Charge
| Attachment | Size |
|---|---|
|
|
622.65 KB |
|
|
88.1 KB |