
Release Date :
Reference Number :
250900 - 0976
Table A. Year-on-Year Inflation Rates,
for the Bottom 30% Income Household, All Items
In Percent
(2018=100)
a. Zamboanga City
1. Inflation Rate for the Bottom 30 percent Income Households
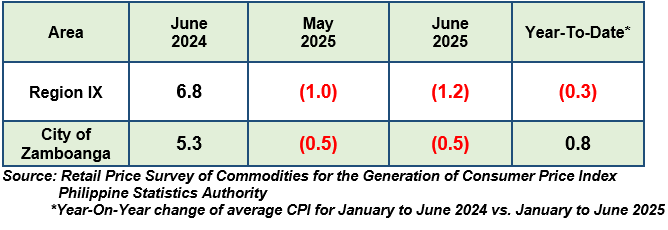
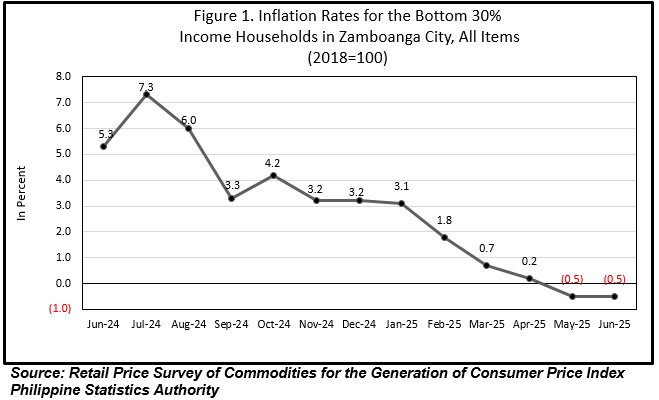
Zamboanga City maintained a steady inflation rate of (0.5) percent in May 2025 and June 2025 for the bottom 30 percent income bracket, indicating a minimal change in prices of the commodities during the month. This was lower than the 5.3 percent inflation recorded in June 2024. In addition, the city’s average inflation from January to June 2025 stood at 0.8 percent (Refer to Table A and Figure 1).
The inflation was observed to be flat in Education Services index, remaining at 6.1 percent from May to June 2025. Similarly, the inflation rates for Information and Communication, and Financial Services also remained unchanged at 0.0 percent, consistent with the figures in the previous month.
In comparison, higher inflation was recorded in the following indices:
a. Alcoholic Beverages and Tobacco, with 0.4 percent from 0.3 percent inflation;
b. Clothing and Footwear at 0.8 percent from 0.7 percent;
c. Housing, Water, Electricity, Gas and Other Fuels, 4.5 percent from 3.5 percent;
d. Transport, (1.6) percent from (2.3) percent;
e. Recreation, Sport and Culture, 6.0 percent from 5.2 percent; and,
f. Personal Care and Miscellaneous Goods and Services at 1.1 percent in June 2025 from 0.8 percent inflation in the previous period.
Among the indices, the following commodity groups posted lower annual increments:
a. Food and Non-alcoholic Beverages, (2.4) percent from (2.0) percent;
b. Furnishing, Household Equipment and Routine Household Maintenance at (0.4) from 0.0 percent in May 2025;
c. Health, 2.1 percent from 2.3 percent; and,
d. Restaurants and Accommodation Services, with 1.0 percent from 1.1 percent inflation
Table B. Year-on-year Inflation Rates for the Bottom 30% Income Households
in Zamboanga City, All items in Percent
January 2021 to January 2025
(2018=100)
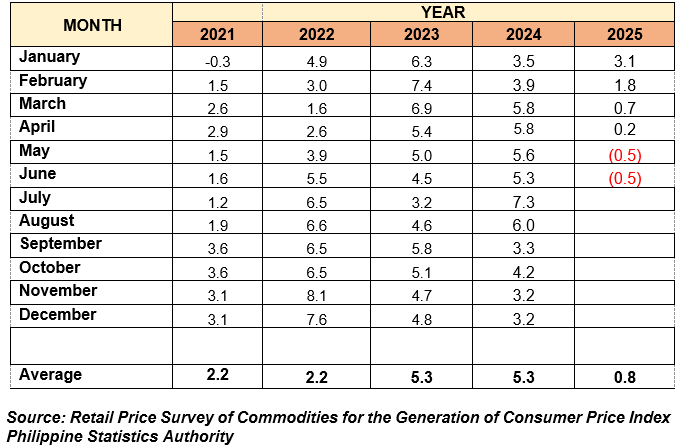
Table C. Inflation Rate by Commodity Group for the Bottom 30% Income Households in
ZAMBOANGA CITY
2018=100
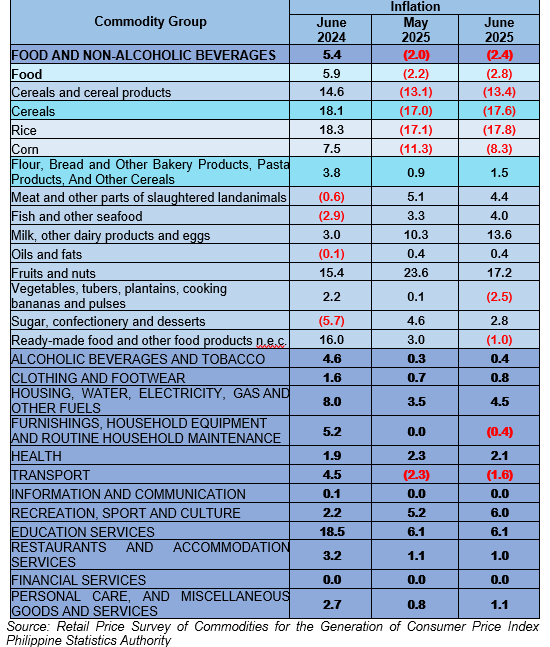
2. Food Inflation
The monthly Food inflation for the bottom 30 percent Income Households in Zamboanga City slowed further to (2.8) percent, down from (2.2) percent in May 2025. This was lower than the recorded Food inflation in June 2024, which stood at 5.9 percent inflation.
The deceleration of food inflation was mainly attributed to the Vegetables, tubers, plantains, cooking bananas and pulses index at (2.5) percent from 0.1 percent. This commodity group accounted for 26.9 percent share of the overall downward trend in food inflation in the city. Followed by Fruits and nuts, which posted 17.2 percent from 23.6 percent; and Ready-made food and other food products at (1.0) percent from 3.0 percent inflation in the previous month.
Slower annual increases were also observed in the following food commodities:
a. Cereals and cereal products, (13.4) percent from (13.1);
b. Meat and other parts of slaughtered land animals, 4.4 percent from 5.1 percent; and,
c. Sugar, confectionery and desserts at 2.8 from 4.6 percent inflation.
On the contrary, higher year-on-year growth rates were recorded within the food indices of:
a. Fish and other seafood, 4.0 percent from 3.3 percent; and,
b. Milk, other dairy products and eggs, 13.6 percent from 10.3 percent inflation in May 2025.
Meanwhile, the Oils and fats index remained at their annual rate in May 2025 at 0.4 percent.
__________________________________________________________________________
Note: CPIs and inflation rates for the bottom 30% income households by region and by province and selected city are posted at the PSA website (http://openstat.psa.gov.ph/).
MEWCHUN WS. PAMARAN
Regional Director
CES/MGCN/kxbl