
Release Date :
Reference Number :
SR-ZDS-2025-0012
1. Overall Inflation
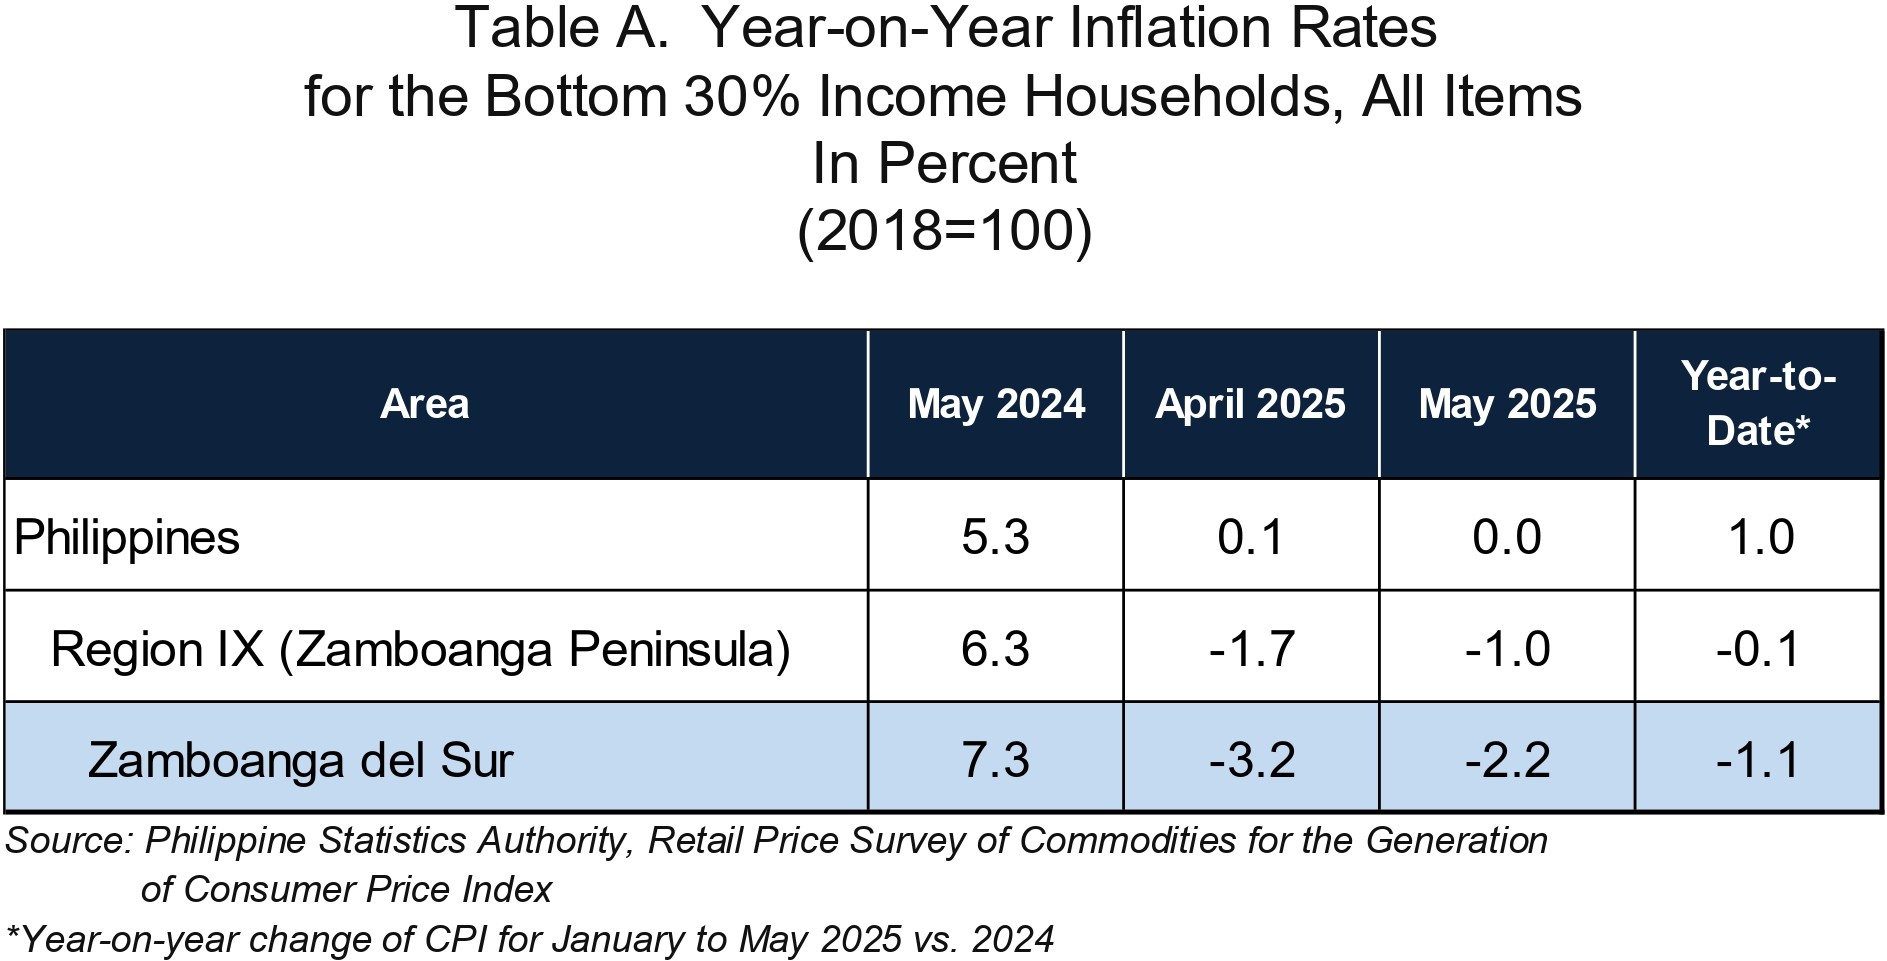
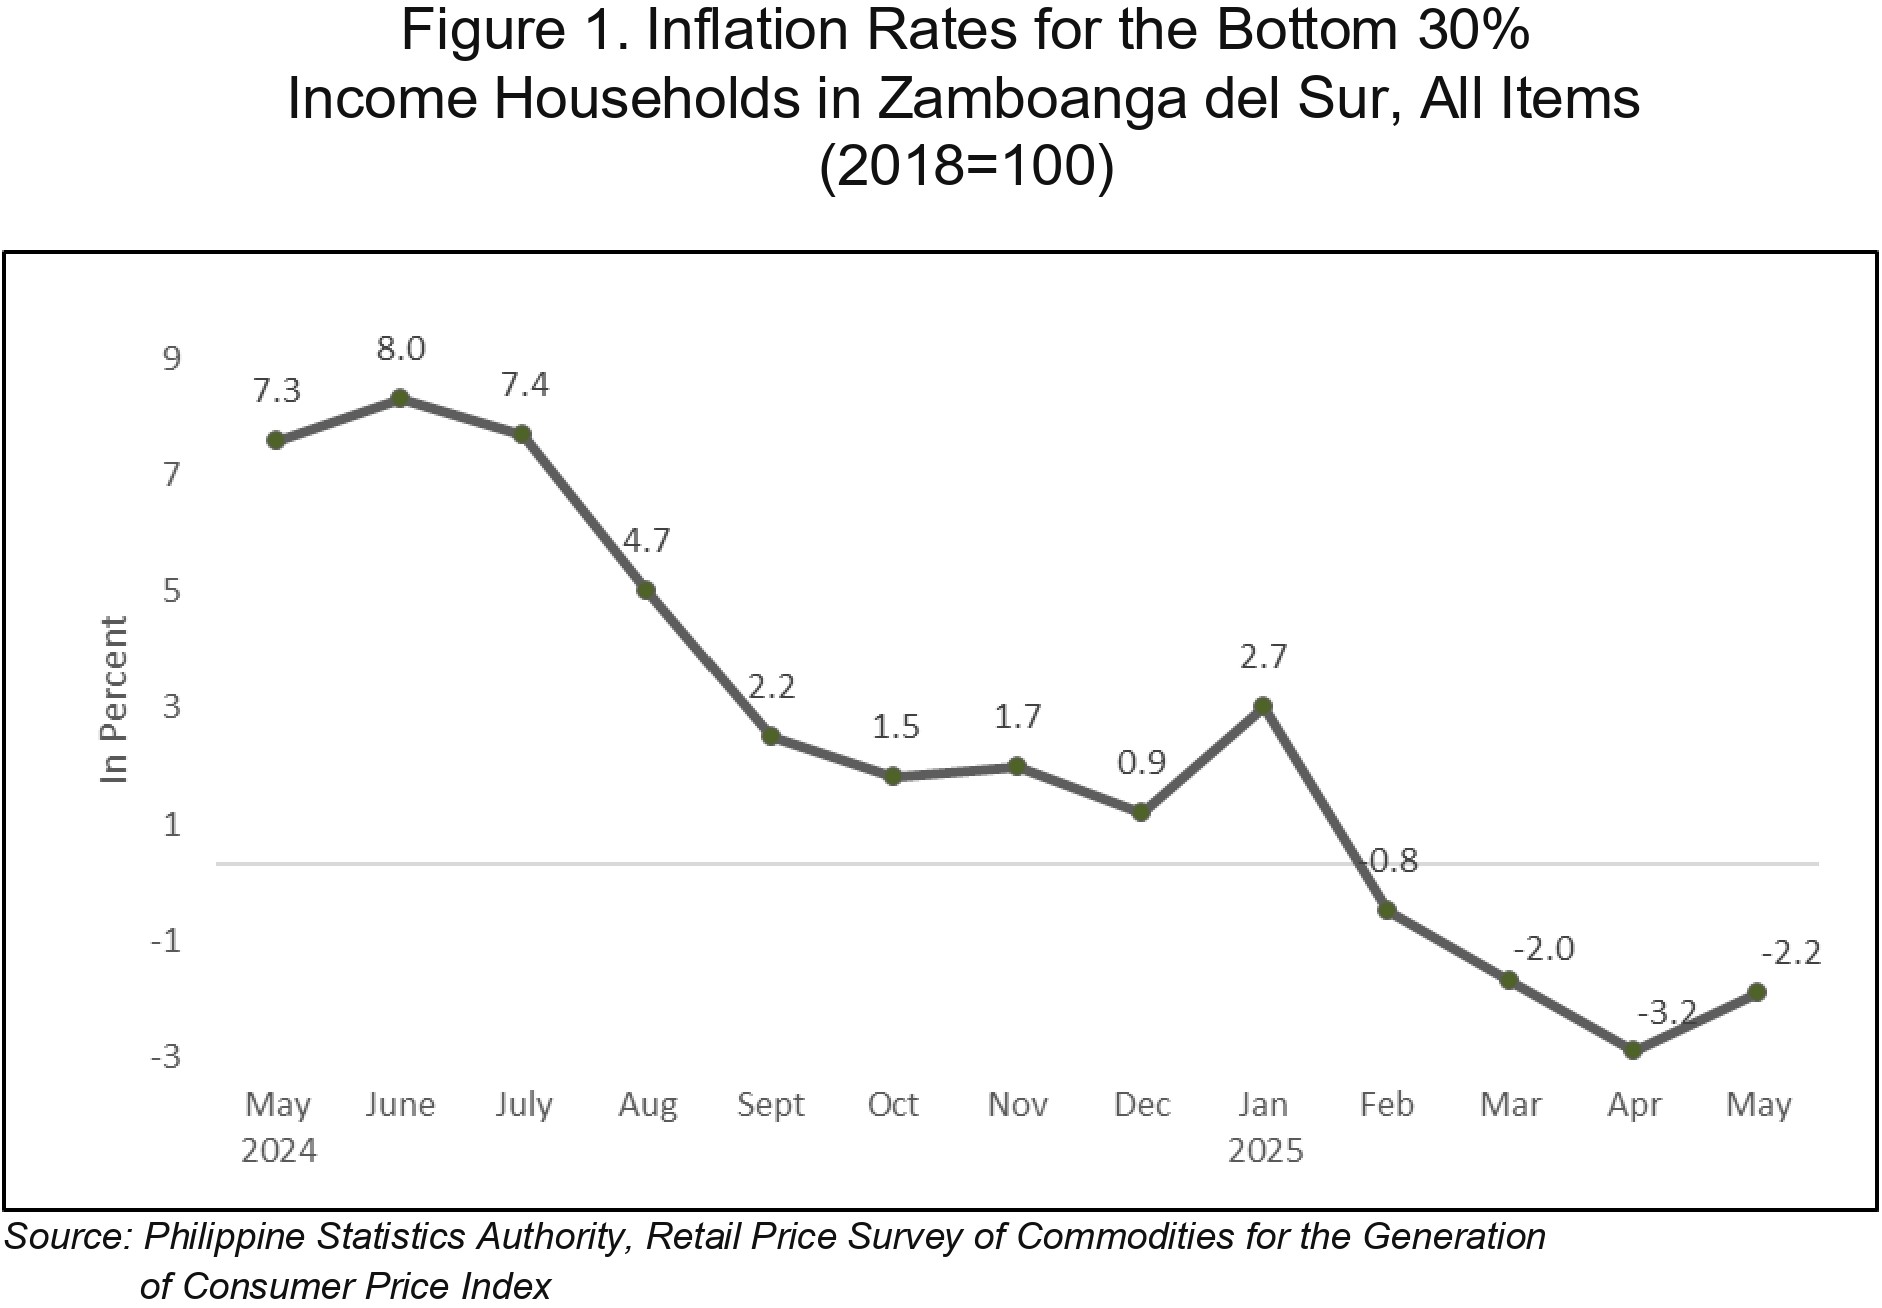
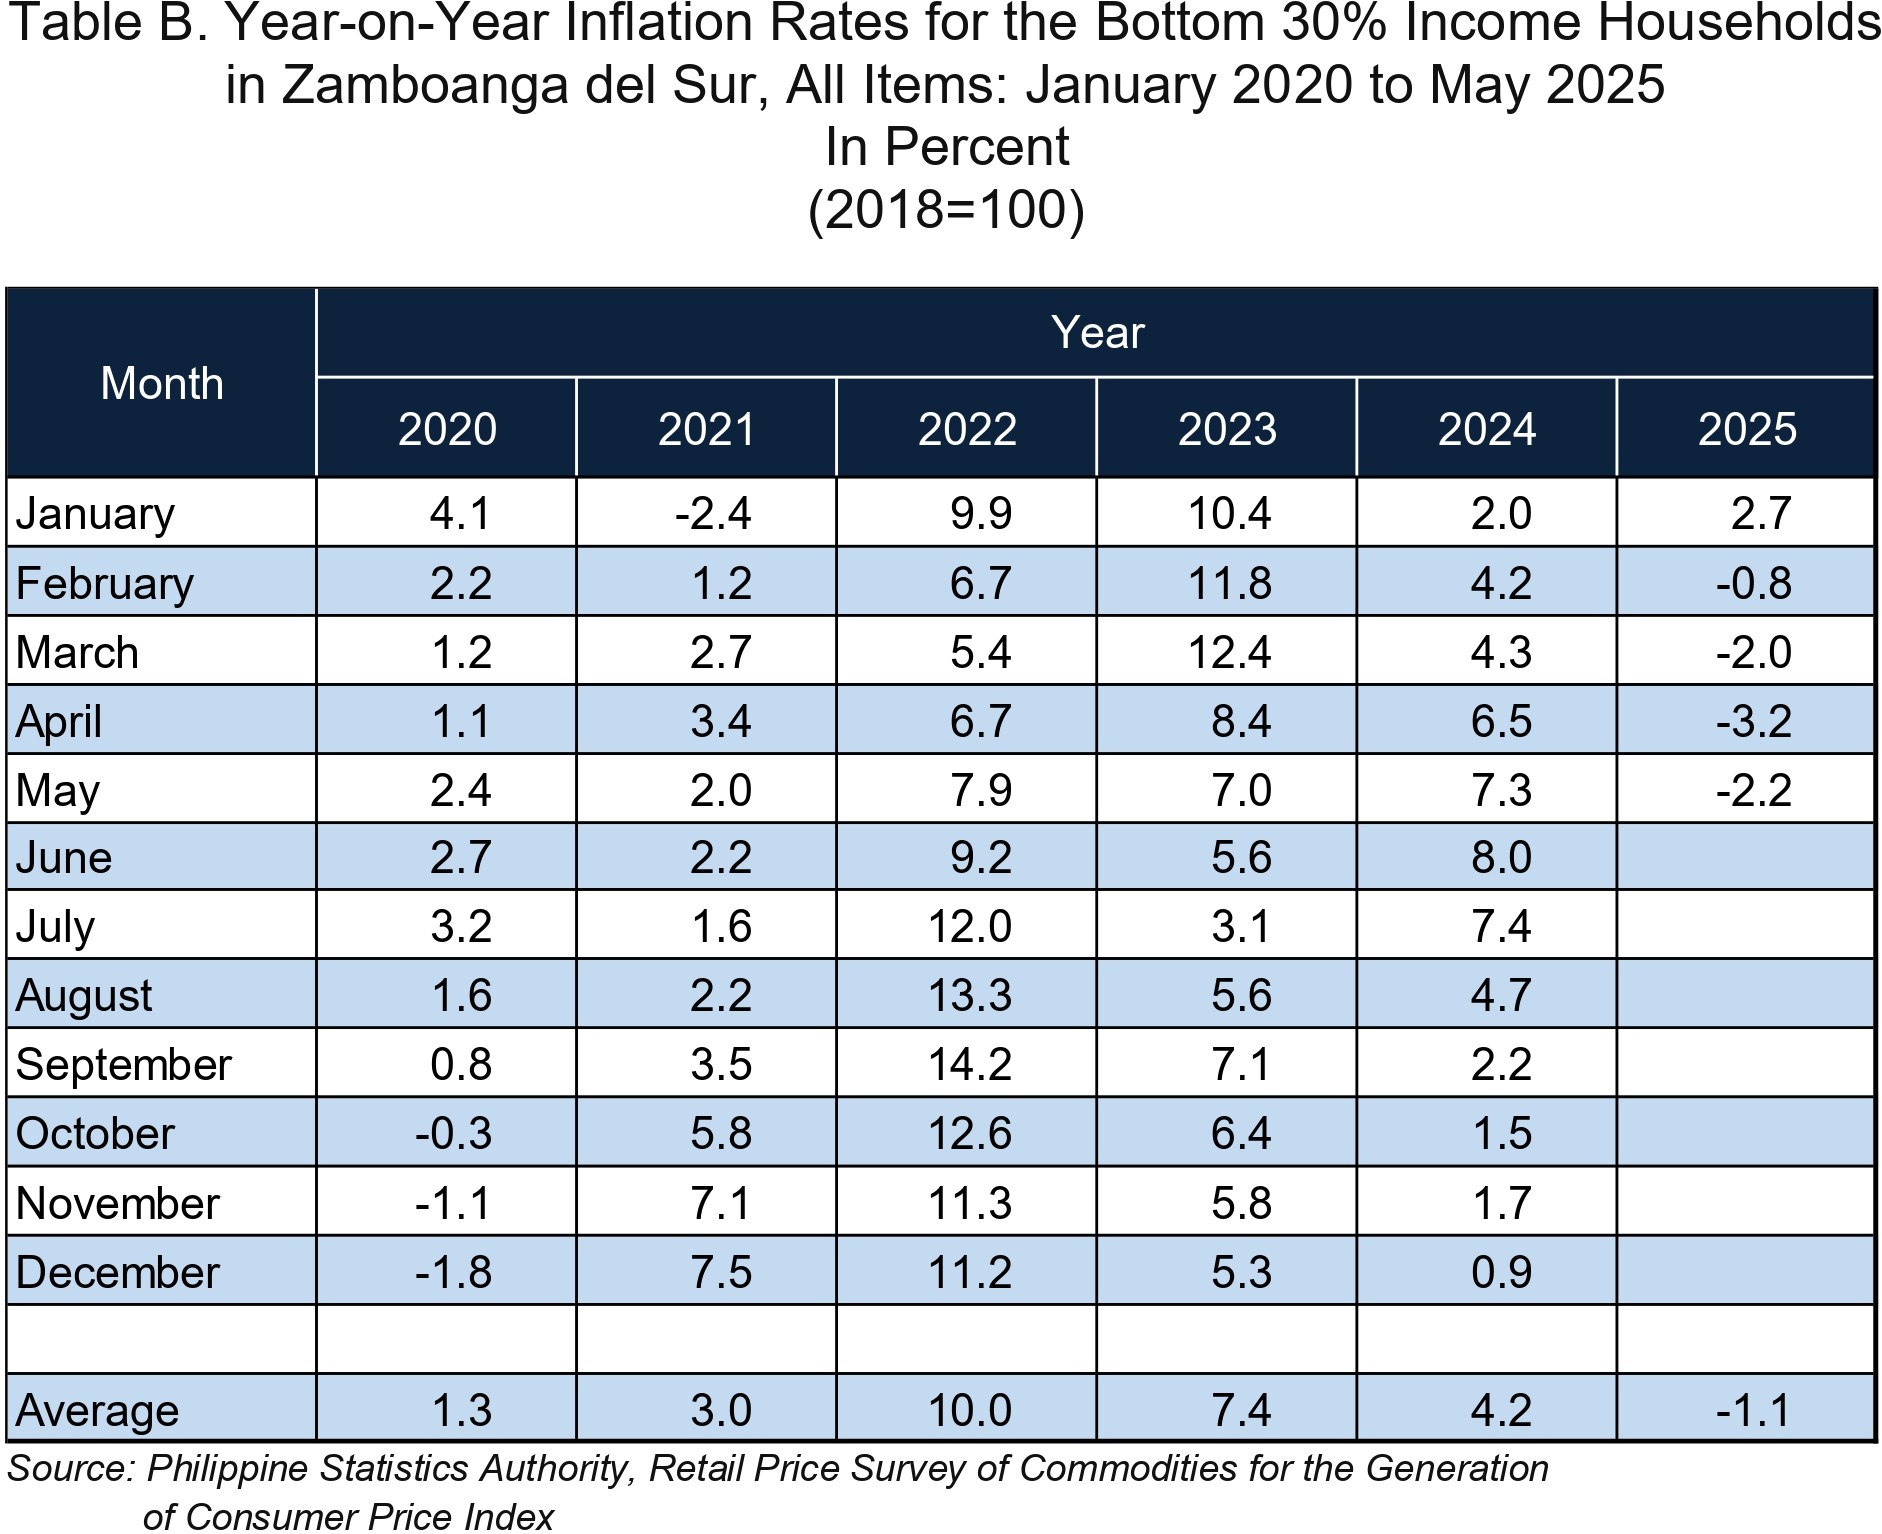
Zamboanga del Sur’s inflation for the bottom 30% income households posted a slower annual decline of 2.2 percent in May 2025 from an annual drop of 3.2 percent in the previous month. In May 2024, the inflation rate was posted at 7.3 percent. (Tables A and B, and Figure 1)
1.1 Main Drivers to the Uptrend of the Overall Inflation
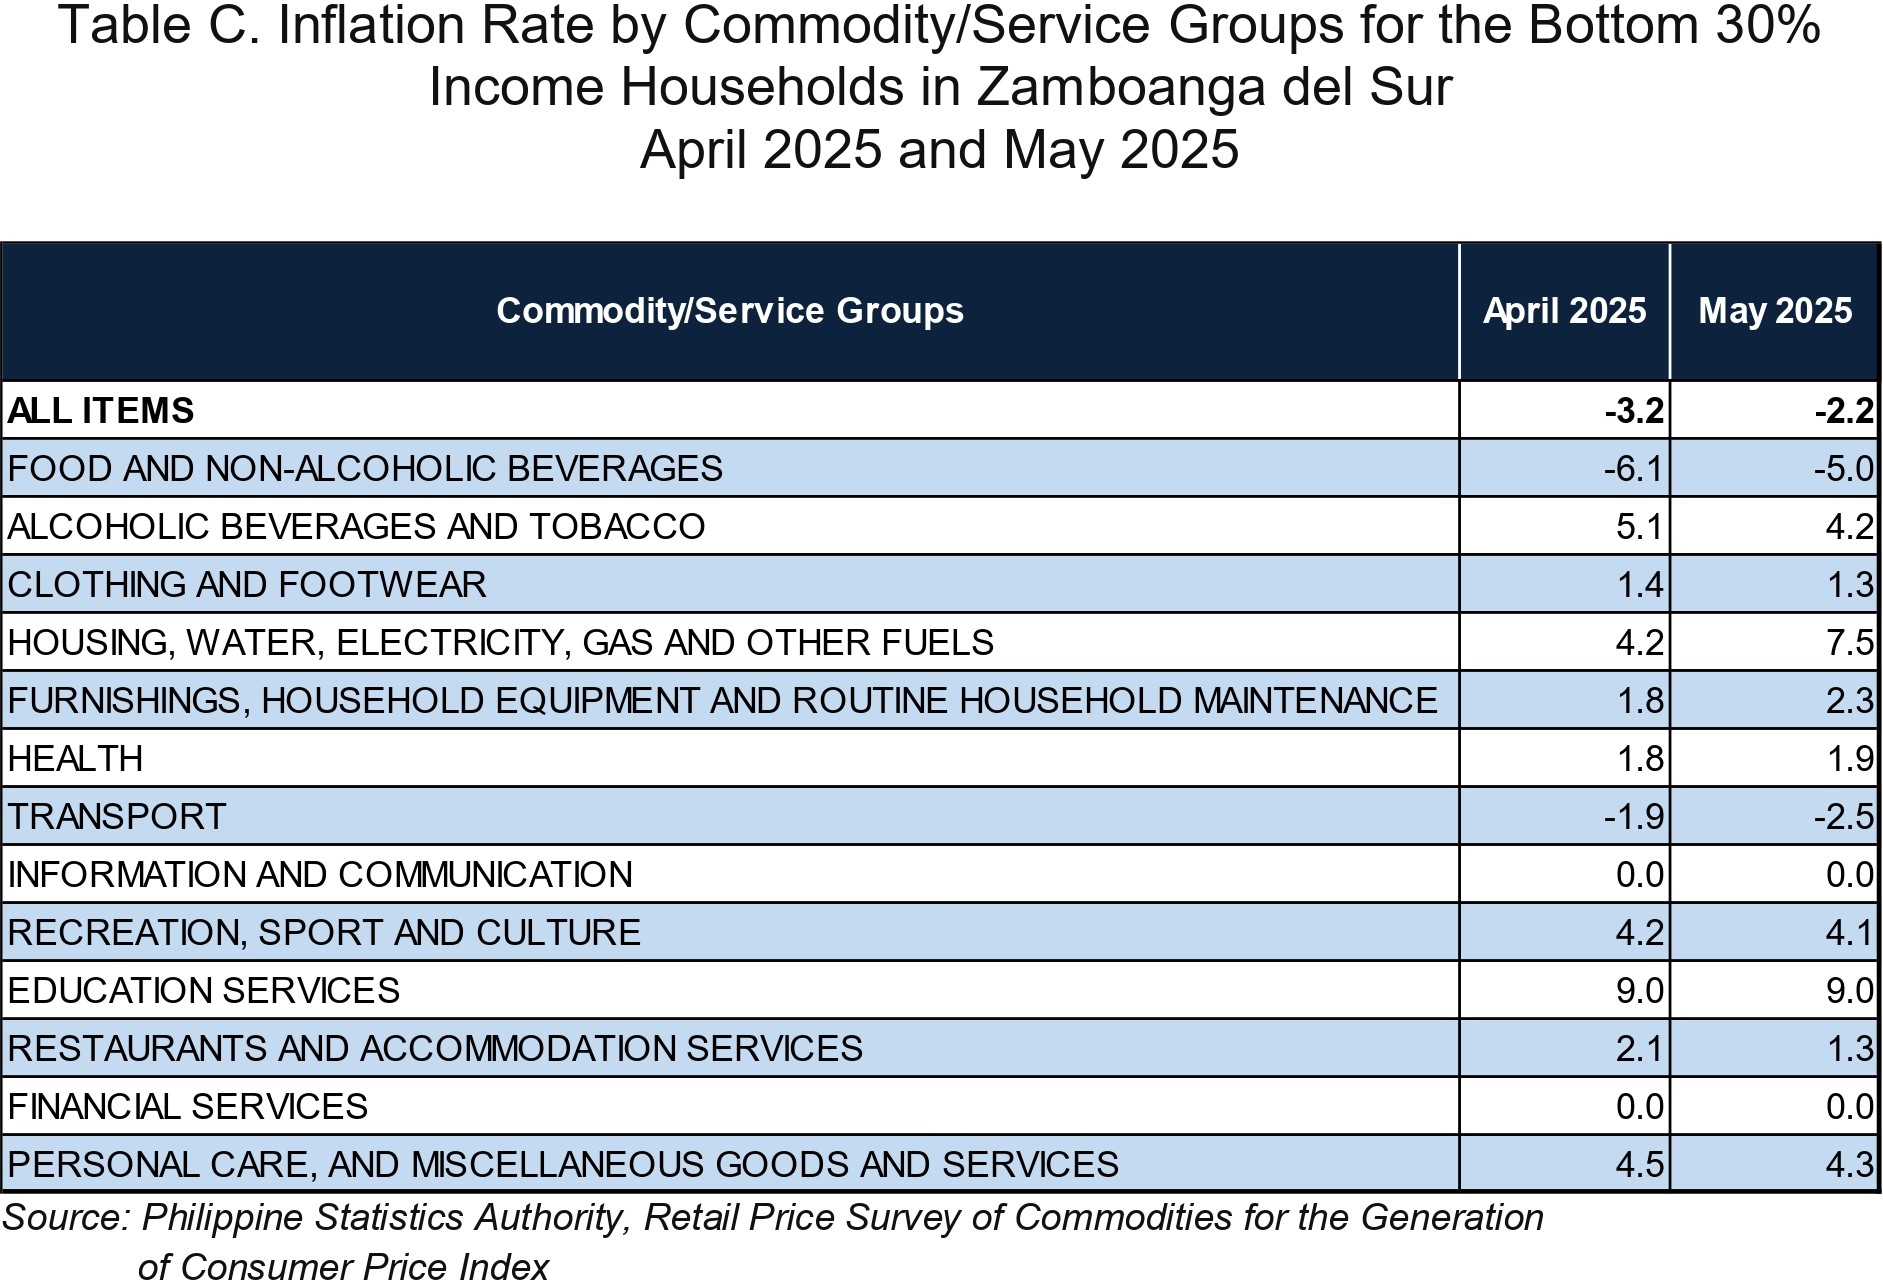
The upward trend in the overall inflation for this income group in May 2025 was primarily brought about by the slower annual decline in the index of food and non-alcoholic beverages at 5.0 percent during the month from a 6.1 percent annual decrease in the previous month. Also contributing to the uptrend was the faster year-on-year increase in the index of housing, water, electricity, gas and other fuels at 7.5 percent during the month from 4.2 percent in April 2025. In addition, a higher inflation rate was recorded for furnishings, household equipment and routine household maintenance at 2.3 percent in May 2025 from 1.8 percent in the previous month.
Moreover, higher annual rate was noted in the index of health at 1.9 percent during the month from 1.8 percent in April 2025.
In contrast, lower annual increments were noted in the indices of the following commodity groups during the month:
a. Alcoholic beverages and tobacco, 4.2 percent from 5.1 percent;
b. Clothing and footwear, 1.3 percent from 1.4 percent;
c. Transport, -2.5 percent from -1.9 percent;
d. Recreation, sport and culture, 4.1 percent from 4.2 percent;
e. Restaurants and accommodation services, 1.3 percent from 2.1 percent; and
f. Personal care, and miscellaneous goods and services, 4.3 percent from 4.5 percent.
The indices of information and communication, education services, and financial services retained their previous month’s annual increment. (Table C)
1.2 Main Contributors to the Overall Inflation
Among the commodity groups, the main contributors to the May 2025 overall inflation were the following:
a. Food and non-alcoholic beverages with 152.1 percent share or -3.35 percentage points; and
b. Transport with 4.6 percent share or -0.10 percentage point. and
2.0 Food Inflation
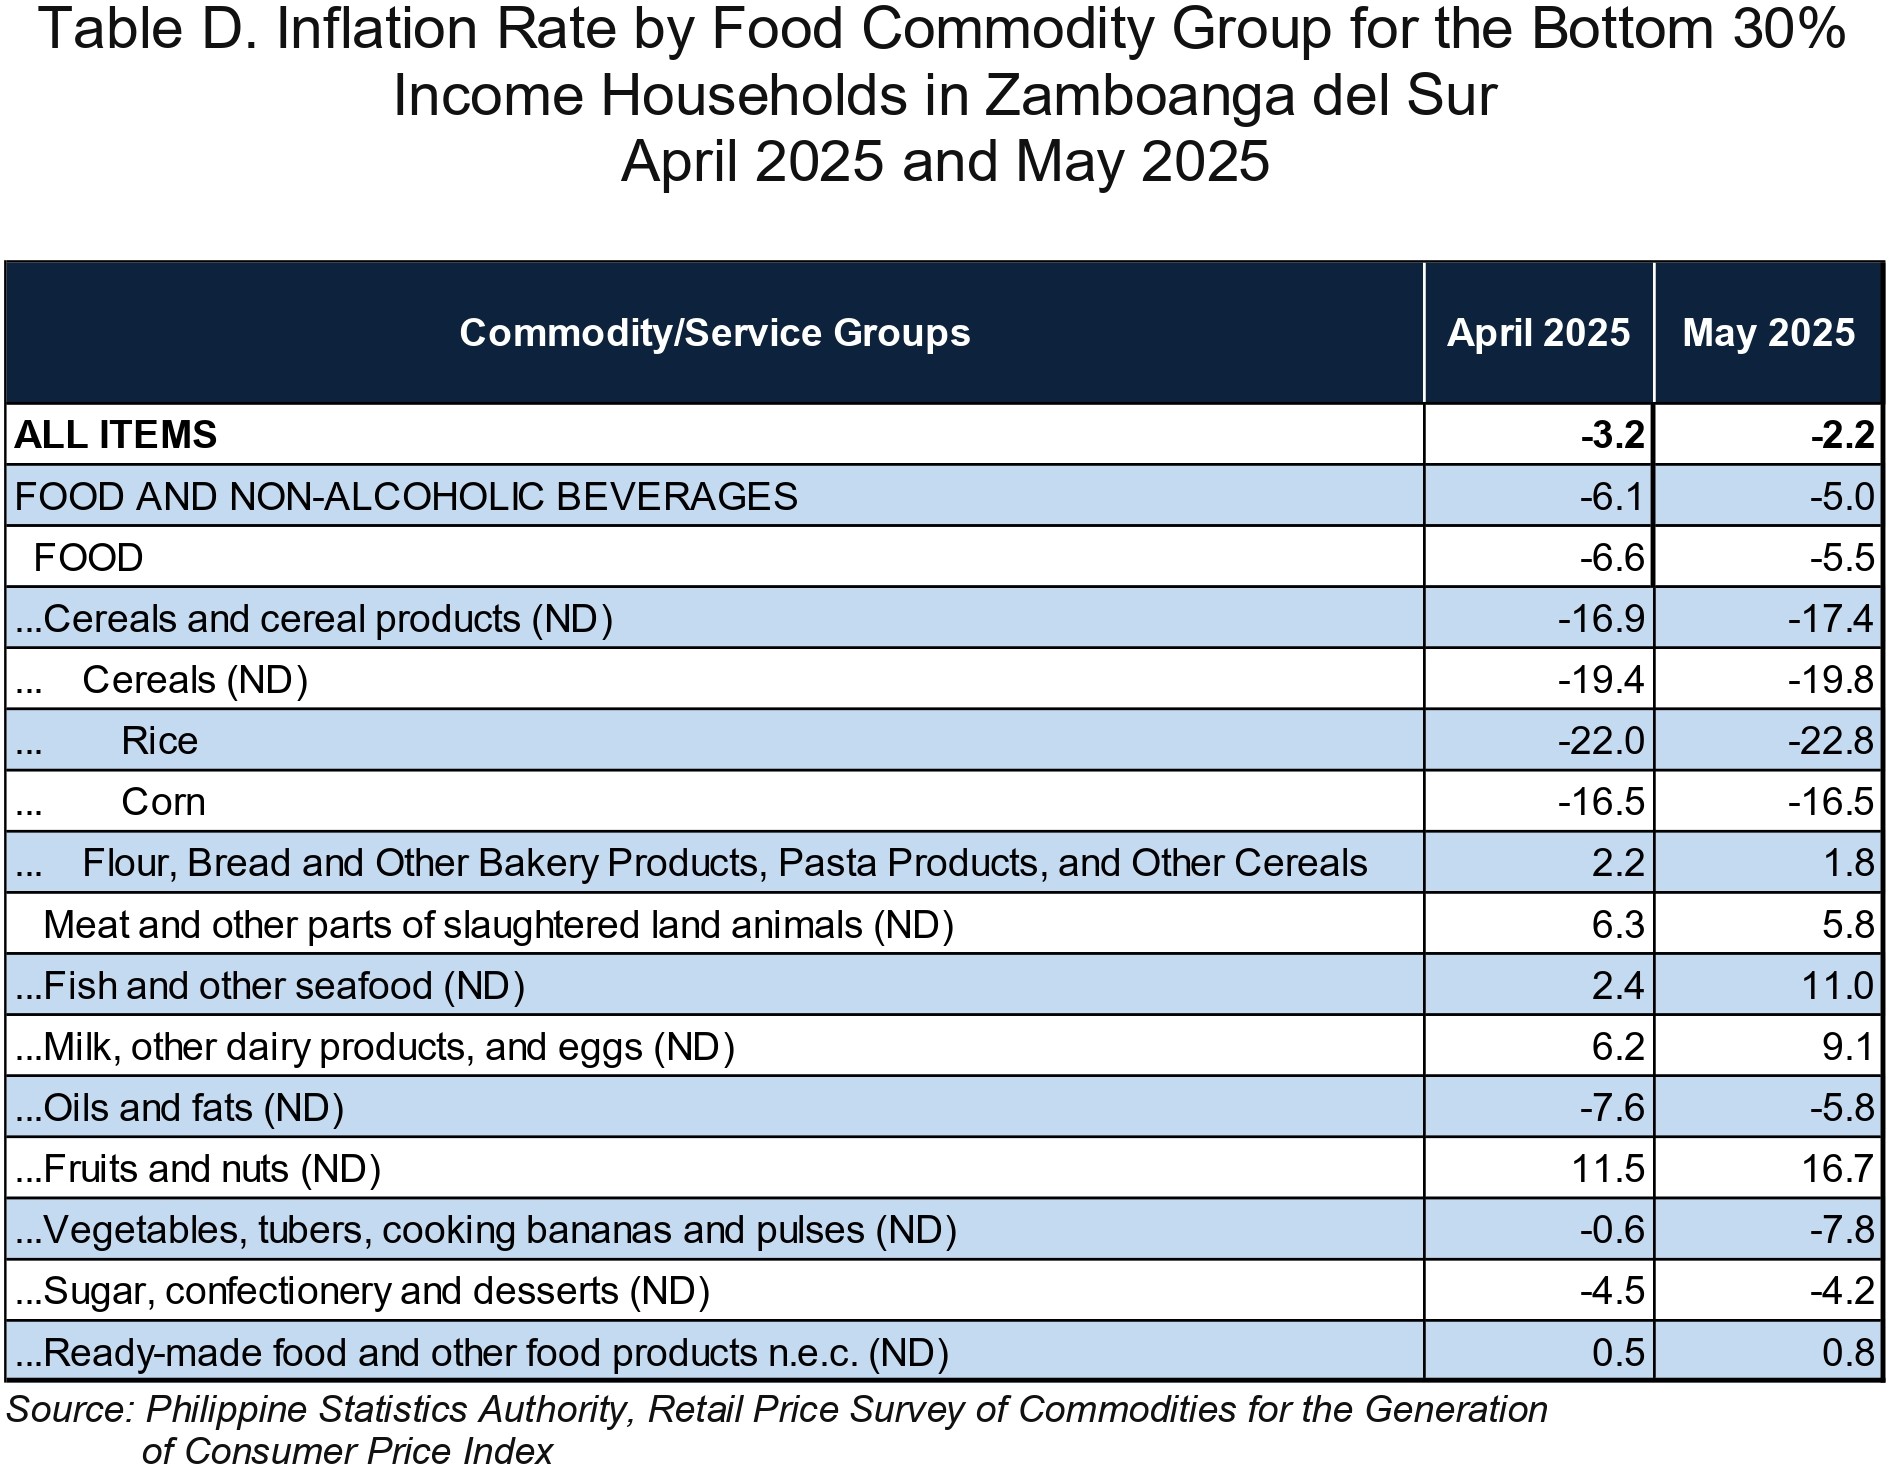
Food inflation for the bottom 30% income households in the province posted a slower annual decline of 5.5 percent in May 2025 from an annual decrease of 6.6 percent in the previous month.
2.1 Main Drivers to the Upward Trend of Food Inflation
The acceleration of food inflation in the province was mainly brought about by the faster annual increase in the index of fish and other seafood at 11.0 percent during the month from 2.4 percent in April 2025. Also contributing to the uptrend was the faster annual increase in the index of milk, other dairy products and eggs at 9.1 percent in May 2025 from 6.2 percent in the previous month.
In addition, higher annual increments were noted in the indices of the following food groups:
a. Oils and fats, -5.8 percent from -7.6 percent;
b. Sugar, confectionery and desserts, -4.2 percent from -4.5 percent; and
c. Ready-made food and other food products, 0.8 percent from 0.5 percent.
In contrast, lower annual increments were noted in the following food groups:
a. Cereals and cereal products, -17.4 percent from -16.9 percent;
b. Meat and other parts of slaughtered land animals, 5.8 percent from 6.3 percent; and
c. Vegetables, tubers, plantains, cooking bananas and pulses, -7.8 percent from -0.6 percent.
2.2 Main Contributors to the Food Inflation
Food inflation contributed 158.6 percent or -3.49 percentage points to the May 2025 overall inflation for this particular income group.
Among the food groups, the main contributors to the food inflation during the month were the following:
a. Cereals and cereal products with 154.0 percent share or -8.47 percentage points;
b. Vegetables, tubers, plantains, cooking bananas and pulses with 12.1 percent share or -0.67 percentage point; and
c. Sugar, confectionery and desserts with 1.8 percent share or -0.10 percentage point.
DIMNA P. BIENES
Chief Statistical Specialist
| Attachment | Size |
|---|---|
|
|
786.16 KB |
|
|
81.83 KB |