
Release Date :
Reference Number :
250900-0191
Table A. Year-on-Year Inflation Rates, All Items
In Percent
(2018=100)
A. Zamboanga Peninsula
1. Headline Inflation
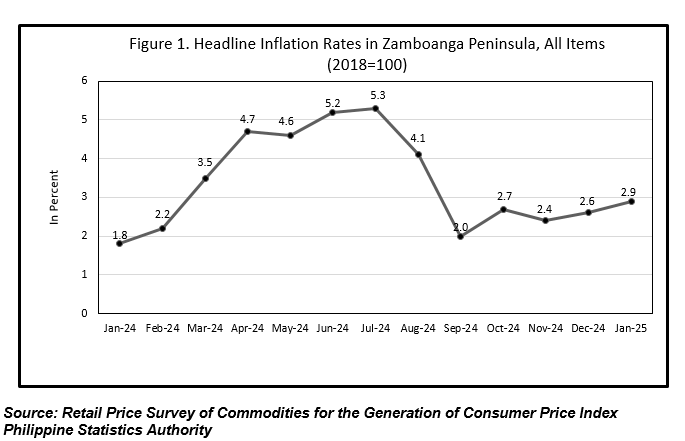
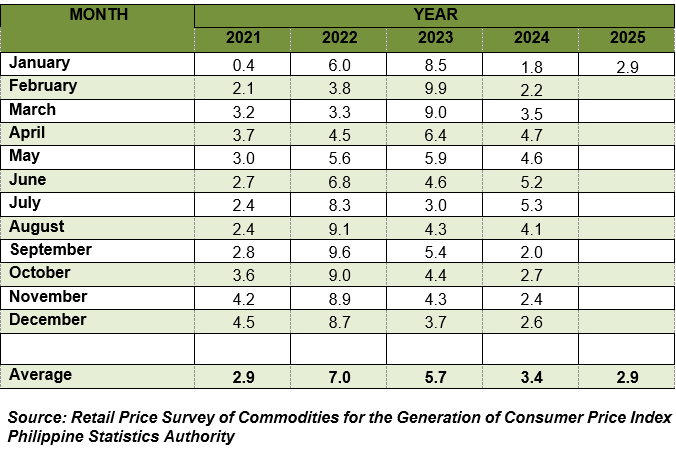
Inflation rate in Zamboanga Peninsula increased further to 2.9 percent in January 2025 from 2.6 percent in December 2024. Inflation rate was lower in January 2024 at 1.8 percent. (Table A and Figure 1)
1.1 Main Drivers to the Upward Trend for the Headline Inflation:
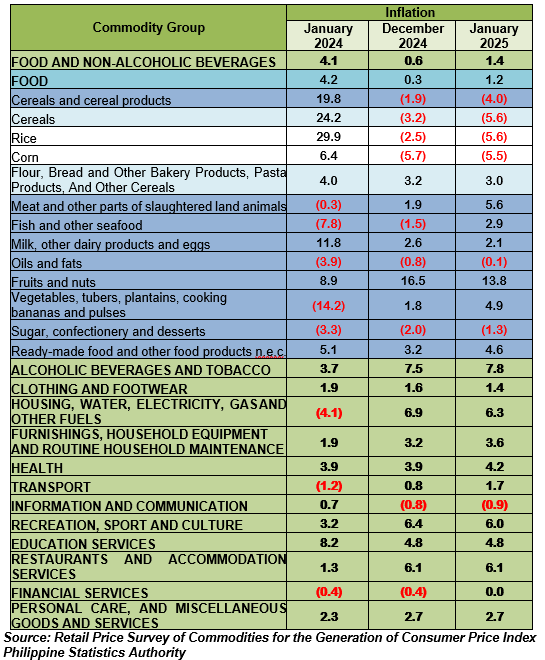
The upward trend in the region’s inflation in January 2025 was primarily influenced by the increase in the indices of Food and Non-alcoholic Beverages at 1.4 percent from 0.6 percent, Transport at 1.7 percent from 0.8 percent and Furnishings, household equipment, and routine household maintenance at 3.6 percent from 3.2 percent.
Moreover, higher inflation rates during the month were recorded in the following commodity groups:
1) Alcoholic beverages and tobacco, 7.8 percent from 7.5 percent;
2) Health, 3.9 percent from 4.2 percent from 3.9 percent; and
3) Financial Services, 0.0 percent from (0.4) percent.
In contrast, lower inflation rate during the month were observed in the following commodity groups:
1) Clothing and footwear, 1.4 percent from 1.6 percent;
2) Housing, water, electricity, gas and other fuels at 6.3 percent from 6.9 percent;
3) Information and communication, (0.9) percent from (0.8) percent; and
4) Recreation, sport and culture, 6.4 percent 6.3 percent.
Meanwhile, the following commodity groups retained their previous month’s inflation rate:
1) Restaurants and Accommodation Services, 6.1 percent;
2) Education Services, 4.8 percent; and
3) Personal Care, and Miscellaneous Goods and Services at 2.7 percent.
2.2 Main Contributors to the Inflation Rate for the Headline Inflation:
The following commodity groups were the top three contributors to the January 2025 overall inflation:
1) Housing, water, electricity, gas and other fuels with 36.4 percent share or 1.06 percentage point;
2) Food and non-alcoholic beverages with 24.2 percent share or 0.7 percentage point; and
3) Restaurants and Accommodation Services with 13.2 percent share or 0.38 percentage point.
Table B. Year-on-year Inflation Rates in Zamboanga Peninsula, All items in Percent
January 2021 to January 2025
(2018=100)
Inflation Rate by Commodity Group for All Income Households in
ZAMBOANGA PENINSULA 2018=100
Food Inflation
Food inflation in Zamboanga Peninsula decelerated to 1.2 percent in January 2025 from 0.3 percent in the previous month. Meanwhile, food inflation in January 2024 was higher at 4.2 percent.
2.1 Main Drivers behind the upward trend of the Food Inflation.
This month’s upward in the category of Food was mainly due by the higher increase in the annual inflation of Fish and other seafood (ND) with 2.9 percent in January 2025 from (1.5) percent in December 2024, Meat and other parts of slaughtered land animals (ND) at 5.6 percent from 1.9 percent in the previous month and Vegetables, tubers, plantains, cooking bananas and pulses (ND) at 4.9 percent from 1.8 percent in the previous month.
Also contributing to the overall food inflation in Zamboanga Peninsula during the month were the indices of the following:
1) Oils and fats (ND), (0.1) percent from (0.8) percent;
2) Sugar, confectionery and desserts (ND), (1.3) percent from (2.0) percent; and
3) Ready-made food and other food products n.e.c (ND), 4.6 percent from 3.2 percent.
Contrarily, the following food groups were observed to have lower increments during the month:
1) Cereal and cereal products (ND), (4.0) percent from (1.9) percent;
2) Milk, other dairy products (ND), 2.1 percent from 2.6 percent; and
3) Fruits and nuts, 13.8 percent from 16.5 percent.
2.2 Main Contributors to the Food Inflation.
Food Inflation contributed 12.0 percent share or 0.31 percentage points to the December 2024 Headline Inflation. Among the food groups, the main contributors to the overall inflation during the month were the following:
1) Meat and other parts of slaughtered land animals (ND) with 90.7 percent share or 1.09 percentage points;
2) Fish and other seafood (ND) with 79.1 percent share or 0.95 percentage point; and
3) Fruits and nuts (ND) with 68.8 percent share or 0.83 percentage points.
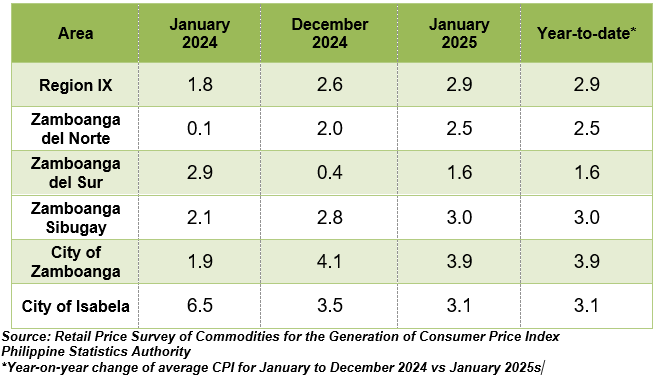
Among the provinces in the region, Zamboanga City had the highest inflation at
3.9 percent, followed by City of Isabela at 3.1 percent, Zamboanga Sibugay at
3.0 percent and Zamboanga del Norte with 2.5 percent inflation. On the other hand, Zamboanga del Sur recorded the lowest inflation which stood at 1.6 percent inflation.
Note: CPIs and inflation rates by province and selected city are posted at the PSA website (http://openstat.psa.gov.ph/).
MEWCHUN WS. PAMARAN
Regional Director
MFET/RRM/ajdc
| Attachment | Size |
|---|---|
|
|
4.16 MB |