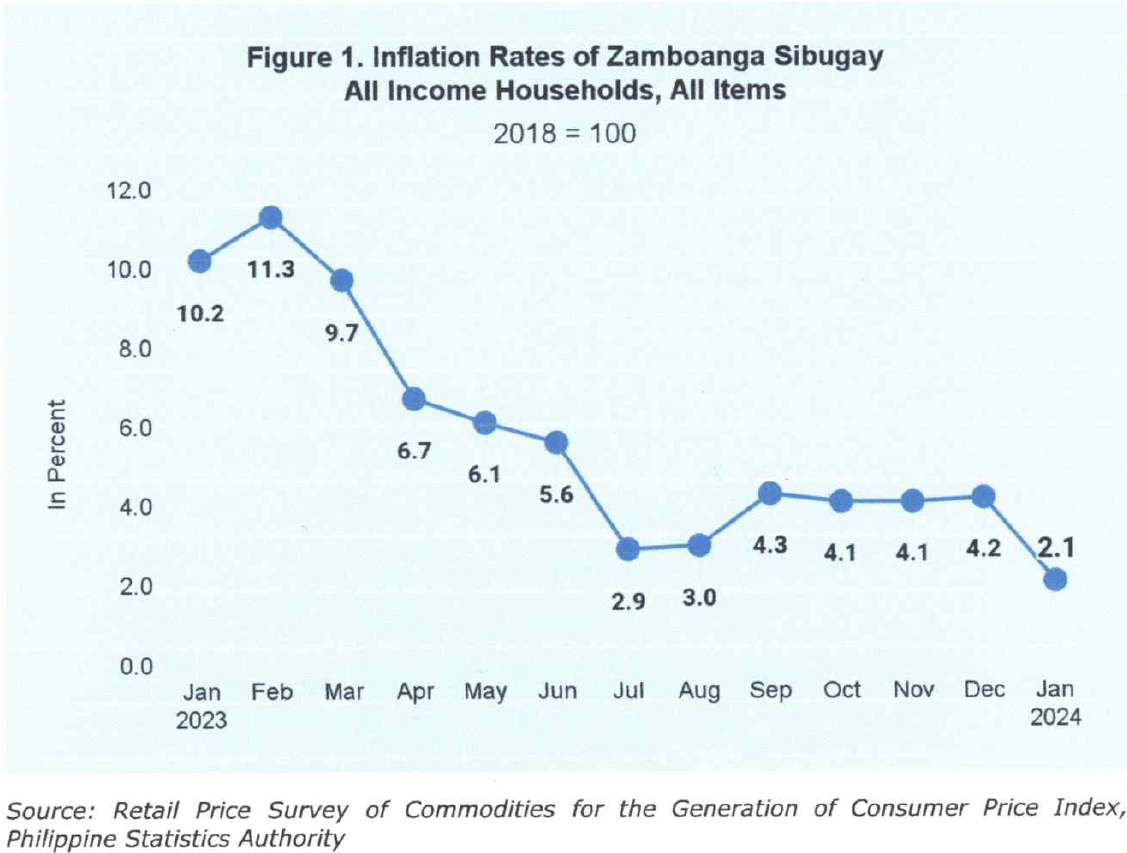
Zamboanga Sibugay's overall inflation declined further to 2.1 percent in January 2024. This is the lowest inflation rate since the 1.3 percent reported in September 2021. It is smaller than the national inflation at 2.8 percent but surpassed the regional rate at 1.8 percent. This is also lower than December 2023's 4.2 percent and even way lower than January 2023's 10.2 percent.
Table 1. Geographical Comparison of Inflation Rates of All Items for All Income Households (2018 = 100)
Area | January 2023 | December 2023 | January 2024 | Year-to-date |
Philippines | 8.7 | 3.9 | 2.8 | 2.8 |
Zamboanga Peninsula | 8.5 | 3.7 | 1.8 | 1.8 |
Zamboanga del Norte | 8.8 | 2.9 | 0.1 | 0.1 |
Zamboanga del Sur | 9.7 | 4.9 | 2.9 | 2.9 |
Zamboanga Sibugay | 10.2 | 4.2 | 2.1 | 2.1 |
Zamboanga City | 6.8 | 3.0 | 1.9 | 1.9 |
Isabela City | 4.2 | 7.7 | 6.5 | 6.5 |
Among five areas in Zamboanga Peninsula, the province ranked third with the lowest inflation. Zamboanga del Norte had the smallest at 0.1 percent followed by Zamboanga City at 1.9 percent. Meanwhile, Zamboanga del Sur came fourth with 2.9 percent and Isabela City landed last with 6.5 percent.

The following commodity groups were the top contributors as to the province's decreasing inflation, including:
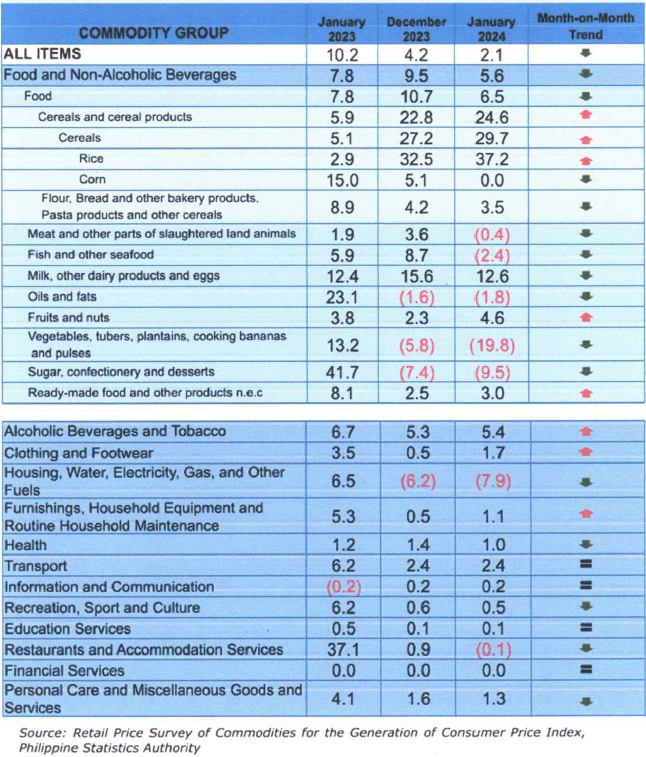
Food and non-alcoholic beverages at 5.6 percent from 9.5 percent, contributing 84.6 percent of the downtrend;
Housing, water, electricity, gas and other fuels at -7.9 percent from -6.2 percent, sharing 9.2 percent; and
Restaurants and accommodation services at -0.1 percent from 0.9 percent, contributing 5.1 percent of the trend.
Moreover, the following commodity groups also recorded a decrease in their inflation rates namely:
Health at 1.0 percent from 1.4 percent;
Recreation, sport and culture at 0.5 percent from 0.6 percent; and
Personal care, and miscellaneous goods and services at 1.3 percent from 1.6 percent.
Table 2. Year-on-Year Inflation Rates in Zamboanga Sibugay
All Income Households, All Items
January 2019-January 2024
(2018=100)
Month | Year | |||||
2019 | 2020 2021 | 022 | 2023 | 2024 | ||
January | 3.8 | 1.0 | 2.4 | 5.1 | 10.2 | 2.1 |
February | 2.3 | 1.4 | 3.9 | 2.7 | 11.3 |
|
March | 1.9 | 1.4 | 5.4 | 2.5 | 9.7 |
|
April | 1.7 | 1.5 | 4.7 | 4.4 | 6.7 |
|
May | 1.9 | 2.1 | 3.8 | 5.6 | 6.1 |
|
June | 0.3 | 2.6 | 2.8 | 6.6 | 5.6 |
|
July | (0.4) | 2.8 | 3.4 | 8.9 | 2.9 |
|
August | (1 .0) | 1.8 | 2.8 | 10.9 | 3.0 |
|
September | (3.2) | 3.7 | 1.3 | 12.3 | 4.3 |
|
October | (2.8) | 2.4 | 2.8 | 11.4 | 4.1 |
|
November | (1.2) | 1.7 | 3.7 | 10.9 | 4.1 |
|
December | (0.6) | 2.3 | 4.1 | 10.1 | 4.2 |
|
Lowest | (3.2) | 1.0 | 1.3 | 2.5 | 2.9 | 2.1 |
Highest | 3.8 | 3.7 | 5.4 | 12.3 | 11.3 | 2.1 |
Average | 0.2 | 2.1 |
| 7.6 | 5.9 | 2.1 |
On the other hand, below are the commodity groups whose inflation indices exhibited upward trend:
Alcoholic beverages and tobacco at 5.4 percent from 5.3 percent;
Clothing and footwear at 1.7 percent from 0.5 percent; and
Furnishings, household equipment and routine household maintenance at 1.1 percent from 0.5 percent;
Meanwhile, four commodity groups maintained their inflation rates including:
Transport at 2.4 percent;
Information and communication at 0.2 percent;
Education services at 0.1 percent; and
Financial services at 0.0 percent.
Table 3. Inflation Rate of Each Major Commodity Group in Zamboanga Sibugay
All Income Households
2018=100

As for the food inflation in Zamboanga Sibugay, the following four sub-food groups indicated a decrease of their inflation rates:
Meat and other parts of slaughtered land animals at -0.4 percent from 3.6 percent;
Fish and other seafood at -2.4 percent from 8.7 percent;
Milk, other dairy products and eggs at 12.6 percent from 15.6 percent;
Oils and fats at -1.8 percent from -1.6 percent;
Vegetables, tubers, plantains, cooking bananas and pulses at -19.8 percent from -5.8 percent; and
Sugar, confectionery and desserts at -9.5 percent from -7.4 percent.
On the contrary, the following sub-food groups recorded an acceleration of their inflation rates namely:
Cereals and cereal products at 24.6 percent from 22.8 percent;
Fruits and nuts at 4.6 percent from 2.3 percent; and
Ready-made food and other food products n.e.c. at 3.0 percent from 2.5 percent.
As to the staple food in the province, rice and corn exhibited an opposing trend in their inflation rates. The former showed an increment of 4.7 percentage points, that is, from 32.5 percent in December 2023 to 37.2 percent in January 2024 while the latter revealed a decrease from 5.1 percent to 0.0 percent.
TECHNICAL NOTES
Uses of CPI
The CPI is most widely used in the calculation of the inflation rate and purchasing power of peso. It is a major statistical series used for economic analysis and as a monitoring indicator of government economic policy.
Computation of CPI
The computation of the CPI involves consideration of the following important points:
Base Year/ Period - A period, usually a year, at which the index number is set to 100. It is the reference point of the index number series.
Market Basket - A sample of the thousands of varieties of goods purchased for consumption and services availed by the households in the country selected to represent the composite price behaviour of all goods and services purchased by consumers.
Weighting System - The weighting pattern uses the expenditures on various consumer items purchased by households as a proportion to total expenditure.
Formula - The formula used in computing the CPI is the weighted arithmetic mean of price relatives, the Laspeyre's formula with a fixed base year period (2006) weights.
Geographic Coverage - CPI values are computed at the national, regional, and provincial levels, and for selected cities.
Note: CPIs and inflation rates by province and selected city are posted at the PSA website (https://openstat.psa.gov.ph/).
ATTY. RICHARD D. TABIGNE
Chief Statistical Specialist
Provincial Statistical Office-Zamboanga Sibugay
