
Release Date :
Reference Number :
240900- 0945
Table A. Year-on-Year Inflation Rates,
for the Bottom 30% Income Household, All Items
In Percent
(2018=100)
A. Zamboanga City
1. Inflation Rate for the Bottom 30% Income Households
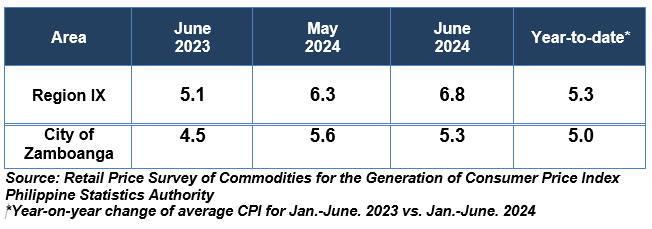
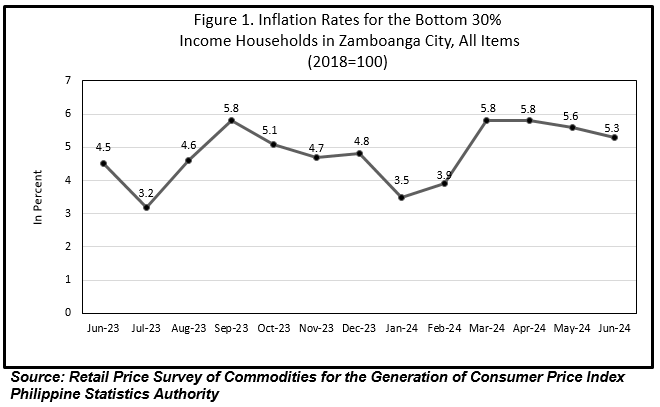
The Zamboanga City’s inflation rate for the bottom 30% slowed down to 5.3 percent in June 2024 from 5.6 percent in May 2024. This was comparatively higher than the inflation rate in June 2023, which posted 4.5 percent. Furthermore, the city’s average inflation from January to June 2024 stood at 5.0 percent. (Table A and Figure 1)
1.1 Main Drivers to the Downward Trend of the Inflation Rate for the Bottom 30% Income
Households
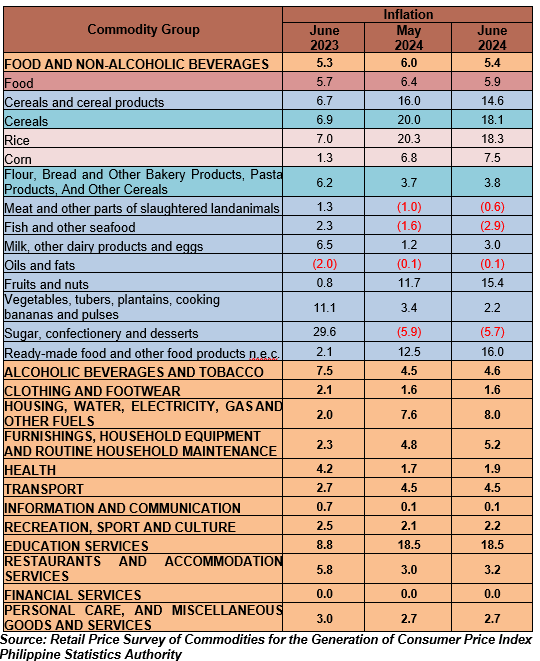
The decrease in inflation rate in June 2024 for the bottom 30% income households in Zamboanga City was mainly driven by slower inflation in the indices of Food and Non-alcoholic Beverages which decelerated at 5.4 percent from 6.0 percent in the previous month.
Contrarily, higher increments were recorded in the following commodity groups:
a) Alcoholic Beverages and Tobacco stood at 4.6 percent from 4.5 percent;
b) Housing, Water, Electricity, Gas and Other Fuels, 8.0 percent from 7.6 percent;
c) Furnishings, Household Equipment and Routine Household Maintenance, 5.2 percent from 4.8 percent;
d) Health, 1.9 percent from 1.7 percent;
e) Recreation, Sport and Culture, 2.2 percent from 2.1 percent; and,
f) Restaurants and Accommodation Services, from 3.0 percent to 3.2.
Meanwhile, the annual rates for the rest of the commodity groups in Zamboanga City remained consistent with those recorded in the previous month. (Table C)
1.2 Main Contributors to the Inflation Rate for the Bottom 30% Income Households
The top three (3) commodity groups contributing to the June 2024 inflation rate for the bottom 30% were the following:
a) Food and Non-alcoholic Beverages which stood at 5.4 percent, contributing 59.1 percent share or 3.1 percentage points;
b) Housing, Water, Electricity, Gas and Other Fuels posted 8.0 percent with 25.2 percent share or 1.3 percentage points; and,
c) Transport posted 4.5 percent with 5.0 percent share or 0.3 percentage points.
Table B. Year-on-year Inflation Rates for the Bottom 30% Income Households
in Zamboanga City, All items in Percent
January 2020- June 2024
(2018=100)
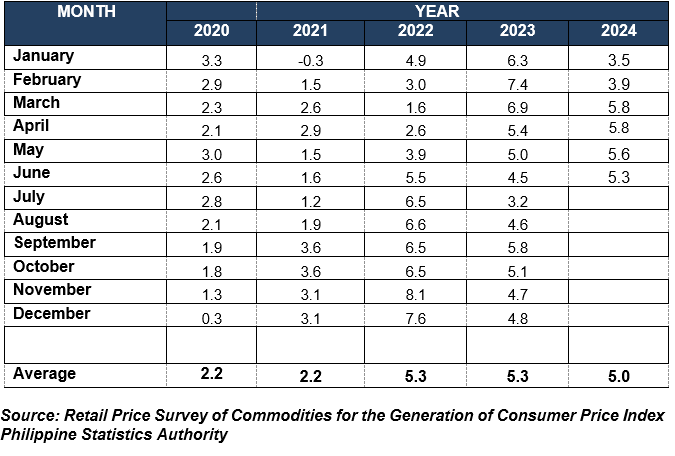
Table C. Inflation Rate by Commodity Group for the Bottom 30% Income Households in
ZAMBOANGA CITY 2018=100
2. Food Inflation
The monthly Food inflation for the bottom 30% Income Households in Zamboanga City decelerated to 5.9 percent in June 2024 from 6.4 percent in May 2024. This was comparatively higher than the recorded Food inflation in June 2023, which stood at 5.7 percent.
2.1 Main Drivers to the Downward Trend of Food Inflation
The deceleration of Food inflation in June 2024 was primarily driven by a slower year-on-year increase in Cereals and Cereal Products index which stood at 14.6 percent in June 2024 from 16.0 percent in the previous month. Additionally, the categories of Fish and Other Seafood, and Vegetables, tubers, plantains, cooking bananas and pulses (ND) also contributed to the downtrend which posted (2.9) percent from (1.6) percent, and 2.2 percent from 3.4 percent, respectively.
Meanwhile, the following food groups recorded to have increased faster during the month:
a) Meat and other parts of slaughtered land animals (ND) at (0.6) percent from (1.0);
b) Milk, other dairy products and eggs (ND), 3.0 percent from 1.2 percent;
c) Fruits and nuts (ND), 15.4 percent from 11.7 percent;
d) Sugar, confectionery and desserts (ND), (5.7) percent from (5.9) percent; and,
e) Ready-made food and other food products n.e.c. (ND) at 16.0 percent from 12.5 percent.
In addition, the food commodity of Oils and fats remained at a stable inflation rate of (0.1) percent.
2.2 Main Contributors to the Food Inflation
Food inflation contributed 58.9 percent share or 3.12 percentage points to the overall inflation for the Bottom 30% Income Households in Zamboanga City. Moreover, the top three (3) Food groups contributing to the June 2024 food inflation were the following:
a) Cereals and Cereal Products, contributing 53.7 percent share or 2.9 percentage points;
b) Ready-made food and other food products n.e.c. (ND) with 5.4 percent share or 0.3 percentage points; lastly,
c) Fruits and nuts (ND), contributing 3.4 percent share or 0.2 percentage points.
__________________________________________________________________________
Note: CPIs and inflation rates for the bottom 30% income households by region and by province and selected city are posted at the PSA website (http://openstat.psa.gov.ph/).
MEWCHUN WS. PAMARAN
Regional Director
MFET/kxbl
| Attachment | Size |
|---|---|
|
|
843.37 KB |